One more thing on correlation…it’s more a continuum and less of a binary “yes/no” finding. That’s how p value and audience analysis fit in. The response data may show strong correlation, but p value could indicate a low chance of repeatability and repeatability is the hallmark of a research finding. In some cases low correlation and low p value are better results than high/low combinations. High/high is optimum, but also not as common as expected.You make a good point with correlation…
You are using an out of date browser. It may not display this or other websites correctly.
You should upgrade or use an alternative browser.
You should upgrade or use an alternative browser.
Pilots Needed For Survey!!!
- Thread starter Sonali Bhat
- Start date
Sonali Bhat
Pre-Flight
- Joined
- Jan 4, 2023
- Messages
- 53
- Display Name
Display name:
Summer
For sure, I feel like a lot of the comments here allowed me to see things from a different perspective, which I 100% appreciate. I think constructive criticism is good, as long as the person giving it to you can actually follow up about why they are saying what they said.I don't think sending it to a pilot specifically would have been necessary. Just some cynical curmudgeon.
But yes, it is extremely difficult to realize your own biases. Often you need someone with a completely different perspective or views to be aware of it. I'd suspect your teacher views these things similarly to you, as evidenced by him having the idea about the covid topic.
Self analysis on anything is one of the hardest things to do. I suck at it.
Yep, usually we have to do self analysis after projects at school, which I’m not very good at as well. It just simply feels better to get this analysis from other people.
Sonali Bhat
Pre-Flight
- Joined
- Jan 4, 2023
- Messages
- 53
- Display Name
Display name:
Summer
Hmm you’re right, I didn’t think of that. What do you mean by low/low, as in how would that be better for your results?One more thing on correlation…it’s more a continuum and less of a binary “yes/no” finding. That’s how p value and audience analysis fit in. The response data may show strong correlation, but p value could indicate a low chance of repeatability and repeatability is the hallmark of a research finding. In some cases low correlation and low p value are better results than high/low combinations. High/high is optimum, but also not as common as expected.
schmookeeg
En-Route
Well this thread has turned into something super interesting, in spite of my kvetching. Now I feel like a heel for giving Sonali a frosty welcome.
My apologies for being unwelcoming @Sonali Bhat. Best of luck with your project and I hope you get a better grade than the C- curse I placed on you.
My apologies for being unwelcoming @Sonali Bhat. Best of luck with your project and I hope you get a better grade than the C- curse I placed on you.
Sonali Bhat
Pre-Flight
- Joined
- Jan 4, 2023
- Messages
- 53
- Display Name
Display name:
Summer
Thank you! And it’s totally okay, I understand.Well this thread has turned into something super interesting, in spite of my kvetching. Now I feel like a heel for giving Sonali a frosty welcome.
My apologies for being unwelcoming @Sonali Bhat. Best of luck with your project and I hope you get a better grade than the C- curse I placed on you.
Besides, it’s graded on a 1-5 scale and not A-F, so let’s hope that gets rid of the curse.
Hmm you’re right, I didn’t think of that. What do you mean by low/low, as in how would that be better for your results?
Remember that correlation is a linear relationship between two variables. If I find the variables in my hypothesis have little relationship to one another, then I want to think about p value, which is about likelihood of repeating one set of outcomes in other experiments.
Plain english means I found a loose relationship that someone is not likely to find if they tried to validate my outcomes. When somebody tries to repeat my outcomes, that’s called peer review and it adds a another level of rigor to prove your work was correct to begin with, not unlike proofs and geometry.
In the case of high (more correctly, strong) correlation and a high likelihood of repeatability, you can end up with spurious correlation such as this example where we find when more cheese consumed is by people, the more likely it is death by bedsheet will occur.
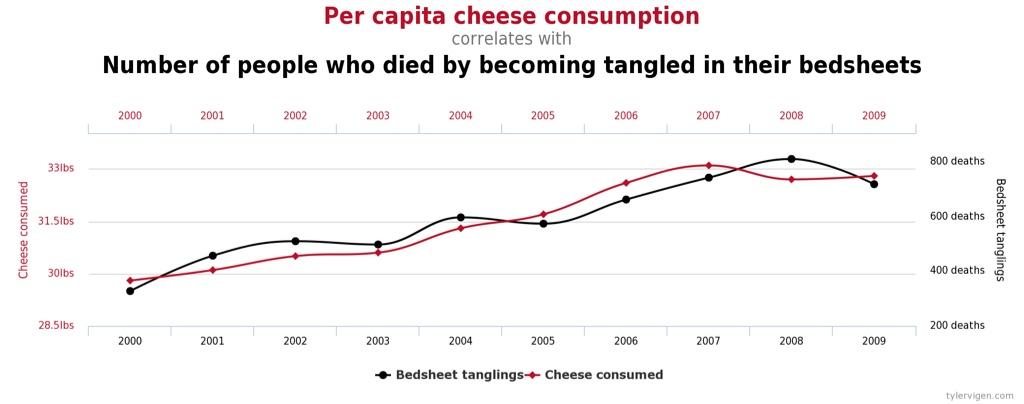
Source: https://www.tylervigen.com/spurious-correlations
In other instances where weak correlation is calculated with a p value indicating high repeatability you run the chance of overlooking the possibility of a research gap being just as likely as other factors that could contribute to that outcome.
That’s kind, but I’m just an amateur at this stuff despite a long ago education in empirical research and methods.@TCABM should at least be a guest speaker for the class.
In my day job I look at business problems to determine if we can teach/train employees behaviors that contribute to improved business performance. My client’s generally want training so they can create a paper trail showing they’ve done everything possible. Then I show up and ask for all their data around the business problem to gain a better understanding. I have to defend my recommendations and things like correlation do contribute to real root cause analysis. Many times my recommendations are counter to the client’s demands so I have to dazzle them with empirical data.
Robinson & Robinson’s Performance Consulting is a good read to understand what I do.
Last edited:
Sac Arrow
Touchdown! Greaser!
- Joined
- May 11, 2010
- Messages
- 20,353
- Location
- Charlotte, NC
- Display Name
Display name:
Snorting his way across the USA
Remember that correlation is a linear relationship between two variables. If I find the variables in my hypothesis have little relationship to one another, then I want to think about p value, which is about likelihood of repeatable one set of outcomes to occur in other experiments.
Plain english means I found a loose relationship that someone is not likely to find if the tried to validate my outcomes. When somebody tries to repeat my outcomes, that’s called peer review and it adds a another level of rigor to prove your work was correct to begin with, not unlike proofs and geometry.
In the case of high (more correctly, strong) correlation and a high likelihood of repeatability, you can end up with spurious correlation such as this example where we find cheese that’s consumed by people, the more likely it is death by bedsheet will occur.
Source: https://www.tylervigen.com/spurious-correlations
In other instances where weak correlation is calculated with a p value indicating high repeatability you run the chance of overlooking the possibility of a research gap being just as likely as other factors that could contribute to that outcome.
That’s kind, but I’m just an amateur at this stuff despite a long ago education in empirical research and methods.
In my day job I look at business problems to determine if we can teach/train employees behaviors that contribute to improved business performance. My client’s generally want training so they can create a paper trail showing they’ve done everything possible. Then I show up and ask for all their data around the business problem to gain a better understanding. I have to defend my recommendations and things like correlation do contribute to real root cause analysis. Many times my recommendations are counter to the client’s demands so I have to dazzle them with empirical data.
Robinson & Robinson’s Performance Consulting is a good read to understand what I do.
The engineer in me will point out that the hypothesis that increased cheese consumption leading to obesity is a causal factor in bedsheet tanglings.
The engineer in me will point out that the hypothesis that increased cheese consumption leading to obesity is a causal factor in bedsheet tanglings.
But does cheese consumption cause obesity and if so, and what point is the scale tipped?
Half Fast
Touchdown! Greaser!
The engineer in me will point out that the hypothesis that increased cheese consumption leading to obesity is a causal factor in bedsheet tanglings.
Curse you, now I can’t get this out of my head...

Sonali Bhat
Pre-Flight
- Joined
- Jan 4, 2023
- Messages
- 53
- Display Name
Display name:
Summer
Okay, I get what you mean in terms of correlation and repeatability. I’m just not understanding how it goes in with my topic, since I’m going to be comparing the different groups of pilots I have in my survey. Just as an example, if I found a correlation in the attitudes of let’s say, CFIs and airline pilots, what would be my ideal result with repeatability and the specific correlation I find?Remember that correlation is a linear relationship between two variables. If I find the variables in my hypothesis have little relationship to one another, then I want to think about p value, which is about likelihood of repeatable one set of outcomes to occur in other experiments.
Plain english means I found a loose relationship that someone is not likely to find if the tried to validate my outcomes. When somebody tries to repeat my outcomes, that’s called peer review and it adds a another level of rigor to prove your work was correct to begin with, not unlike proofs and geometry.
In the case of high (more correctly, strong) correlation and a high likelihood of repeatability, you can end up with spurious correlation such as this example where we find cheese that’s consumed by people, the more likely it is death by bedsheet will occur.
Source: https://www.tylervigen.com/spurious-correlations
In other instances where weak correlation is calculated with a p value indicating high repeatability you run the chance of overlooking the possibility of a research gap being just as likely as other factors that could contribute to that outcome.
That’s kind, but I’m just an amateur at this stuff despite a long ago education in empirical research and methods.
In my day job I look at business problems to determine if we can teach/train employees behaviors that contribute to improved business performance. My client’s generally want training so they can create a paper trail showing they’ve done everything possible. Then I show up and ask for all their data around the business problem to gain a better understanding. I have to defend my recommendations and things like correlation do contribute to real root cause analysis. Many times my recommendations are counter to the client’s demands so I have to dazzle them with empirical data.
Robinson & Robinson’s Performance Consulting is a good read to understand what I do.
Sometimes it’s easy for me to understand topics with different examples, but when it comes to interpreting that concept with my own topic, it can be a struggle.
And that sounds like an interesting job, I might read that book if I have time.
Sonali Bhat
Pre-Flight
- Joined
- Jan 4, 2023
- Messages
- 53
- Display Name
Display name:
Summer
Oh yeah. We definitely need one of those.. Our class is very lost, and some people haven’t even started distributing their surveys, even though CollegeBoard’s timeline says we should’ve started in November and should be getting our results and closing up surveys by the beginning of February. I started at the beginning of this month because the teacher kept saying we needed our topics “approved” before we can start, but never followed up until after Christmas break. It definitely put us a bit behind..@TCABM should at least be a guest speaker for the class.
Either way, I think we’re in need of a panelist later on to provide opinions on the presentation/paper and ask POD (presentation oral defense) questions.
Sac Arrow
Touchdown! Greaser!
- Joined
- May 11, 2010
- Messages
- 20,353
- Location
- Charlotte, NC
- Display Name
Display name:
Snorting his way across the USA
Oh yeah. We definitely need one of those.. Our class is very lost, and some people haven’t even started distributing their surveys, even though CollegeBoard’s timeline says we should’ve started in November and should be getting our results and closing up surveys by the beginning of February. I started at the beginning of this month because the teacher kept saying we needed our topics “approved” before we can start, but never followed up until after Christmas break. It definitely put us a bit behind..
Either way, I think we’re in need of a panelist later on to provide opinions on the presentation/paper and ask POD (presentation oral defense) questions.
Maybe it's a stupid question, but what degree are you working towards?
Sonali Bhat
Pre-Flight
- Joined
- Jan 4, 2023
- Messages
- 53
- Display Name
Display name:
Summer
If you mean currently, then I’m only in high school. Still got another year to go.. But this class itself is an AP class for high schoolers, and if you get a 3 or higher then you’re eligible for college credit (depending on the college). If you meant in the future, I’m wanting to major in Finance or Marketing (marketing as a first choice).Maybe it's a stupid question, but what degree are you working towards?
The ideal result is for there to be a high level of repeatability, which is predicted by p value. P value is calculated from the sample size of your population.…Just as an example, if I found a correlation in the attitudes of let’s say, CFIs and airline pilots, what would be my ideal result with repeatability and the specific correlation I find?…
In your case, you would want to first know if your total number of valid responses meet the threshold to be considered a statistically significant sample size. The FAA estimated for an estimated 720,605 active airmen certificates in 2021. For a population of that size, 384 is the minimum number of responses to achieve a p value of .05, which means there’s a 95% chance of someone else achieving essentially similar outcomes.
Taking it a step further for ATP holders (not all are airline pilots, but that’s the limitation of the data), you’d want a proportional number of the responses to come from ATPs. FAA estimated 163,694 active ATPs in 2021, so your sub population is about 23% of the total and for CFIs, it’s 121,270 or 17%. If the data shows you have responses in those proportions and quantities, the correlation you find among CFIs and ATPs is likely to be repeated by others, which means it’s also likely to be representative of the entire ATP or CFI population as a whole.
Here’s a gotcha though. Independent research would lead you to understand there is a subset of certificated airmen that actively hold both an ATP and a CFI…it introduces complexity to the problem because you’d want to incorporate that knowledge in your survey design…maybe ask a question to select the highest FAA certificate held and limit it to one selection among several choices. There’s a bias there though that assumes the highest held certificate indicates the privileges most used. You could attempt to control for that by subsequently asking a question about occupation and list airline pilot, flight instructor, contract pilot, corporate pilot, other paid commercial pilot, etc.
Does that help?
Sac Arrow
Touchdown! Greaser!
- Joined
- May 11, 2010
- Messages
- 20,353
- Location
- Charlotte, NC
- Display Name
Display name:
Snorting his way across the USA
If you mean currently, then I’m only in high school. Still got another year to go.. But this class itself is an AP class for high schoolers, and if you get a 3 or higher then you’re eligible for college credit (depending on the college). If you meant in the future, I’m wanting to major in Finance or Marketing (marketing as a first choice).
Wow, sounds like an ambitious project for high school. Good luck with that.
Sonali Bhat
Pre-Flight
- Joined
- Jan 4, 2023
- Messages
- 53
- Display Name
Display name:
Summer
Yeah, that definitely helps, thanks! The airline pilot vs CFI thing was only an example but I see how there would be many complex factors involved in trying to make that correlation. When I get my results, I’ll probably describe how the attitudes are among different groups, but will be careful and considerate of all the factors before making direct correlations like the one mentioned above. With p value, 384 is definitely the goal, but I hope it’ll be possible to get that many within the timeframe I have. Right now, it’s going pretty consistently as I’m getting around 5-15 responses per day (more or less). Only thing I’m afraid of is if my responses per day just slowly start to decline. Do you have any recommendations on how to get my survey more “out there” so I can get this desired amount of responses? Before sending the survey out I was considering making an incentive such as a giveaway for a $20 amazon gift card.. but that would require me to collect personal information which I don’t really need to be doing.The ideal result is for there to be a high level of repeatability, which is predicted by p value. P value is calculated from the sample size of your population.
In your case, you would want to first know if your total number of valid responses meet the threshold to be considered a statistically significant sample size. The FAA estimated for an estimated 720,605 active airmen certificates in 2021. For a population of that size, 384 is the minimum number of responses to achieve a p value of .05, which means there’s a 95% chance of someone else achieving essentially similar outcomes.
Taking it a step further for ATP holders (not all are airline pilots, but that’s the limitation of the data), you’d want a proportional number of the responses to come from ATPs. FAA estimated 163,694 active ATPs in 2021, so your sub population is about 23% of the total and for CFIs, it’s 121,270 or 17%. If the data shows you have responses in those proportions and quantities, the correlation you find among CFIs and ATPs is likely to be repeated by others, which means it’s also likely to be representative of the entire ATP or CFI population as a whole.
Here’s a gotcha though. Independent research would lead you to understand there is a subset of certificated airmen that actively hold both an ATP and a CFI…it introduces complexity to the problem because you’d want to incorporate that knowledge in your survey design…maybe ask a question to select the highest FAA certificate held and limit it to one selection among several choices. There’s a bias there though that assumes the highest held certificate indicates the privileges most used. You could attempt to control for that by subsequently asking a question about occupation and list airline pilot, flight instructor, contract pilot, corporate pilot, other paid commercial pilot, etc.
Does that help?
Sonali Bhat
Pre-Flight
- Joined
- Jan 4, 2023
- Messages
- 53
- Display Name
Display name:
Summer
Thanks, I really appreciate it!Wow, sounds like an ambitious project for high school. Good luck with that.
Rgbeard
En-Route
- Joined
- Aug 26, 2017
- Messages
- 4,257
- Location
- Phoenix, AZ and Ensenada, Mexico
- Display Name
Display name:
rgbeard
Had it not been for Covid, I would have probably not have done the great Sedona picnic in 2020 with @Pilawt.
It's the single factor that allowed me a flight to our local Class B airport just for giggles.
Covid didn't negatively impact me in any real measurable way at work. It had positive effects because it pushed certain customer projects forward.
Not negatively impacted, can't really answer your survey the way you've engineered it.
Rgbeard
En-Route
- Joined
- Aug 26, 2017
- Messages
- 4,257
- Location
- Phoenix, AZ and Ensenada, Mexico
- Display Name
Display name:
rgbeard
Well this thread has turned into something super interesting, in spite of my kvetching. Now I feel like a heel for giving Sonali a frosty welcome.
My apologies for being unwelcoming @Sonali Bhat. Best of luck with your project and I hope you get a better grade than the C- curse I placed on you.
Add me to the list of apologetic frosties. Good luck to you and best wishes on your project. I know I bugged a lot of people in the stone-age when I was doing papers for my degrees.
…Do you have any recommendations on how to get my survey more “out there” so I can get this desired amount of responses?..
R/flying
If you don’t get 384, just calculate p value for the number of responses you received. If you need help, let me know.
Sonali Bhat
Pre-Flight
- Joined
- Jan 4, 2023
- Messages
- 53
- Display Name
Display name:
Summer
No worriesAdd me to the list of apologetic frosties. Good luck to you and best wishes on your project. I know I bugged a lot of people in the stone-age when I was doing papers for my degrees.
Thank you so much!Sonali Bhat
Pre-Flight
- Joined
- Jan 4, 2023
- Messages
- 53
- Display Name
Display name:
Summer
I posted it there once, tried to repost a while ago and it got deleted.R/flying
If you don’t get 384, just calculate p value for the number of responses you received. If you need help, let me know.

Thanks for all your help, and will do!
No kidding. I can see why she's in an advanced placement class. I question why the teacher is however.Wow, sounds like an ambitious project for high school. Good luck with that.
Take half of what @TCABM (seriously, phenomenal stuff from sgoti) has said and she'll be more qualified than the teacher is. You're gonna do fine kid. Hopefully we didn't pull you too far off topic.
Last edited:
AKiss20
Line Up and Wait
If it were not for @TCABM this student would’ve likely left this forum thinking GA is filled with a bunch of jerks all trying to one up each other on how loudly they can yell about politics. Maybe this is a good lesson for the older and, theoretically, more mature posters who did so to not jump to conclusions so as to confirm their own biases (which is exactly what they accused OP of doing)? Just saying.
@Sonali Bhat I filled out your survey and wish you the best of luck on this and all your future academic endeavors.
@Sonali Bhat I filled out your survey and wish you the best of luck on this and all your future academic endeavors.
Sonali Bhat
Pre-Flight
- Joined
- Jan 4, 2023
- Messages
- 53
- Display Name
Display name:
Summer
For sure!No kidding. I can see why she's in an advanced placement class. I question why the teacher is however.
Take half of what @TCABM (seriously, phenomenal stuff from sgoti) has said and she'll be more qualified than the teacher is. You're gonna do fine kid. Hopefully we didn't pull you too far off topic.
And yeah, all good! Thanks for all the help, it means a lot.Sonali Bhat
Pre-Flight
- Joined
- Jan 4, 2023
- Messages
- 53
- Display Name
Display name:
Summer
Good point. I’m also glad that I was open minded to everyone’s responses, it allowed me to see things from a new perspective which I’m still grateful for.If it were not for @TCABM this student would’ve likely left this forum thinking GA is filled with a bunch of jerks all trying to one up each other on how loudly they can yell about politics. Maybe this is a good lesson for the older and, theoretically, more mature posters who did so to not jump to conclusions so as to confirm their own biases, which is exactly what they accused OP of doing? Just saying.
@Sonali Bhat I filled out your survey and wish you the best of luck on this and all your future academic endeavors.
Thank you so much for the help and feedback, it means a lot!
No kidding. I can see why she's in an advanced placement class. I question why the teacher is however.
Take half of what @TCABM (seriously, phenomenal stuff from sgoti) has said and she'll be more qualified than the teacher is. You're gonna do fine kid. Hopefully we didn't pull you too far off topic.
Again, that’s kind. I’ve made some assumptions about the rigor necessary for her class and in doing so have probably overly complicated it. For example, all the statistical stuff needs to he figured out in advance as a control and p value is really only useful testing a null hypothesis. I’m guessing after the fact math to extract a confidence interval would be more appropriate for the assignment, but alas….
Someone once said you can only learn research methods by doing them; the corollary is every time you do a research project you learn how little you know about research.
If it were not for @TCABM this student would’ve likely left this forum thinking GA is filled with a bunch of jerks all trying to one up each other on how loudly they can yell about politics...
Eh, I gave some negative tone feedback as well, but seeing someone open to learning provided an opportunity. Credit goes to the OP.
ebetancourt
Line Up and Wait
If it were not for @TCABM this student would’ve likely left this forum thinking GA is filled with a bunch of jerks all trying to one up each other on how loudly they can yell about politics. Maybe this is a good lesson for the older and, theoretically, more mature posters who did so to not jump to conclusions so as to confirm their own biases (which is exactly what they accused OP of doing)? Just saying.
@Sonali Bhat I filled out your survey and wish you the best of luck on this and all your future academic endeavors.
Since I'm probably one of the oldest participants here (U.F.O. eligible), I will point out that your age bias is showing. I don't think my post "jumped to conclusions" based on bias.
JOhnH
Touchdown! Greaser!
I too am among the older crowd, and I was one of the first that jumped to her defense.Since I'm probably one of the oldest participants here (U.F.O. eligible), I will point out that your age bias is showing. I don't think my post "jumped to conclusions" based on bias.
AKiss20
Line Up and Wait
“Who did so” was in the sentence. Given that you two did not perform the action I described, you are not in the group I was referring to.Since I'm probably one of the oldest participants here (U.F.O. eligible), I will point out that your age bias is showing. I don't think my post "jumped to conclusions" based on bias.
I admit I assumed that those in that group are older than a high school student. Mea culpa if anyone in that group is younger than her.
Sonali Bhat
Pre-Flight
- Joined
- Jan 4, 2023
- Messages
- 53
- Display Name
Display name:
Summer
True, I was looking at a calculator for respondents and I found that it said confidence level instead of p value which ranged from 85%-99%. Is that much different from p value or not really?Again, that’s kind. I’ve made some assumptions about the rigor necessary for her class and in doing so have probably overly complicated it. For example, all the statistical stuff needs to he figured out in advance as a control and p value is really only useful testing a null hypothesis. I’m guessing after the fact math to extract a confidence interval would be more appropriate for the assignment, but alas….
Someone once said you can only learn research methods by doing them; the corollary is every time you do a research project you learn how little you know about research.
Eh, I gave some negative tone feedback as well, but seeing someone open to learning provided an opportunity. Credit goes to the OP.
And you’re right, I thought I at least new a little about research, and boy was I humbled.
But hey, always happy to learn something new.True, I was looking at a calculator for respondents and I found that it said confidence level instead of p value which ranged from 85%-99%. Is that much different from p value or not really?
And you’re right, I thought I at least new a little about research, and boy was I humbled.
Conceptually the are similar, but that’s about as far as it goes.
It appears you’re doing a sentiment study and confidence level is most appropriate. Later on you’ll learn to calculate that in advance as a control for your study and the data returned will be analyzed for standard deviation from either the mean or for the population.
It’s been a few years since I’ve done work on that side of the field, but determining CL after the fact won’t be acceptable at the collegiate level. But you’ll have spent a semester on research methodology and a semester on basic statistical analysis before you put it all together.
Sonali Bhat
Pre-Flight
- Joined
- Jan 4, 2023
- Messages
- 53
- Display Name
Display name:
Summer
Alright, so I guess it should be okay to determine CL at this point since I didn’t really know what to do before I started.. Especially bc I need a discussion point on my paper when it comes to saying how I determined the number of respondents I need. Honestly, I thought that I only needed 100 or so responses before starting this but that’s not enough at all.Conceptually the are similar, but that’s about as far as it goes.
It appears you’re doing a sentiment study and confidence level is most appropriate. Later on you’ll learn to calculate that in advance as a control for your study and the data returned will be analyzed for standard deviation from either the mean or for the population.
It’s been a few years since I’ve done work on that side of the field, but determining CL after the fact won’t be acceptable at the collegiate level. But you’ll have spent a semester on research methodology and a semester on basic statistical analysis before you put it all together.
I definitely do want to get more into research, so hopefully we’ll be trained better on the technical stuff in college. Unfortunately I still have another school year to go until then.
Sonali Bhat
Pre-Flight
- Joined
- Jan 4, 2023
- Messages
- 53
- Display Name
Display name:
Summer
Also, what margin of error and CL do you think would be acceptable for this project? I was thinking 90% and 5.5%, but not completely sure how to determine these 2.Conceptually the are similar, but that’s about as far as it goes.
It appears you’re doing a sentiment study and confidence level is most appropriate. Later on you’ll learn to calculate that in advance as a control for your study and the data returned will be analyzed for standard deviation from either the mean or for the population.
It’s been a few years since I’ve done work on that side of the field, but determining CL after the fact won’t be acceptable at the collegiate level. But you’ll have spent a semester on research methodology and a semester on basic statistical analysis before you put it all together.
Also, what margin of error and CL do you think would be acceptable for this project? I was thinking 90% and 5.5%, but not completely sure how to determine these 2.
Q: Is CL and CI required for your project? If so, your data analysis will require identifying them mean and standard deviation for each question for each response. If not, you’re best served doing basic analysis of your responses and instead bring this up in the lessons learned/areas for improvement.
Common CLs are 95% and 99%. Common Confidence Intervals (margin of error) are 90% (10 points), 95% (5 pts) or 99% (1 pt) but others can be used. The reason these are chosen is design phase is because it drives your sample size for the population studied. The lower the CL and CI, the fewer valid responses needed.
There are valid reasons to choose lower CLs and CIs, to include cost or time constraints or even rigor (peer review or no) requirments but not necessarily to improve the chances of validating your theory, even though many polls do exactly that.
Half Fast
Touchdown! Greaser!
And you’re right, I thought I at least new a little about research, and boy was I humbled.
You've learned quite a bit, I hope, about how unintentional and unnoticed biases can sway a survey and produce incorrect results. You've also learned, though you may not realize it, a little tiny bit about how to construct a survey intentionally to produce desired results.
This opens up a whole new ballgame.
If you go into research as a career, you will possibly work for a research firm that gets hired to conduct research for businesses, governments, news organizations, etc. Sometimes they're truly seeking accurate data, perhaps to inform and influence product development, and you need to know how to get it for them. But other times they will want to use research to sway public or customer opinions. Knowing how to conduct a survey to get a result, and do it unobtrusively, is also a marketable skill. (I won't get into the ethics of it here, but I consider it in the same genre as marketing, not science, per se.)
Trust me - when Battlecreek Breakfast Foods, Inc., asks you for a survey, what they're looking for is proof that Krispi-Krunchies is the tastiest and healthiest cereal of all time. The Ironlung Tobacco Company will be looking for data that demonstrates that their cigarettes are quite healthy and that cigarette breath combined with tobacco-stained teeth are considered very sexy indeed.
And when Reid-Hillview airport wants an environmental study, they'll be paying you to prove that lead from avgas is causing brain damage in children so that they can shut down the airport and sell the land to real estate developers. You can read a ton about that fiasco here on PoA.
Knowing that this sort of "research" can be done, how it's done, and that it is done, should make you very skeptical of any studies you read. A healthy degree of skepticism will serve you well.
Last edited:
I just did the survey.
I found it to be a reasonable survey. Like RgBeard, I thought it could have been tweaked but pretty exceptional for a high school project. I didn't find it biased although I have the distinct impression the main objective is to determine how covid impacted the aviation training/ student pilot community and the impact it may have on alleviating the pilot shortage (yeah - I know - some of you don't believe there's a shortage).
Good job. All my best!
Hang 4
Pattern Altitude
- Joined
- Aug 18, 2017
- Messages
- 2,333
- Display Name
Display name:
Hang 4
I took the survey also. Pretty darn good for a HS student. Suspect some of the feedback has been a learning experience as well. Also good to see Sonali continuing to participate and roll with the punches.