2 different fuel flow figures in a Cruise Performance Chart for a constant speed prop. What??

JackFliesGA

Filing Flight Plan
Joined
Aug 29, 2023
Messages
23
Display Name

Display name:
Jack L.
I’m trying to do some fuel calc for my first cross country in a DA40 with a constant prop and mixture + prop speed + throttle controls.

From my fixed prop training, I had associated a specific RPM with a fuel flow.

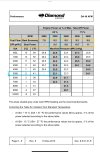
But this chart seems to suggest that you can get different flow rates at the same RPM setting in a certain percent-of-takeoff-power?

How do I know which flow to use?

Example:

At 5000’ MSL, at standard temps, to get 65% Takeoff Power, I need to 2200 RPMs at 23.1 inhg manifold pressure. But what fuel flow is that??
IMG_0198.jpeg
 
Airplanes performance changes as they age. When it comes to planning you want to plan a buffer in as well. I’d plan 75% and go with 12gph. Then you’ll never run out of fuel.
 
The table is not completely accurate as variation of mixture at a given RPM and MP will result in variations of percentage power. When setting the mixture for cruise flight you might lean to best economy fuel flow for that RPM/MP but in doing so the engine will make less power and the plane will go slower than it would if leaned only to best power. You can make up for this by increasing RPM or MP slightly to hold (say) 65% power, but this is not shown in the chart.

Separate from your question but as shown in the table, at a given power output an engine is more fuel efficient when run at lower RPM. In order to make up for the lower RPM but not lower percentage power, you operate at higher manifold pressure. This is the same thing as driving a manual shift car in a higher gear with more throttle opening on the Interstate. Then once RPM/MP is set up you lean as desired.
 
Are you leaning for best power or best economy?
In a fixed pitch prop, i thought you leaned for both because a leaner mixture, at say 5000, increases rpm which means to me, and increase in power.
 
In a fixed pitch prop, i thought you leaned for both because a leaner mixture, at say 5000, increases rpm which means to me, and increase in power.
If you lean still further, RPM will start to drop. That's because you're now leaner than peak power mixture.
 
8.2 to 9.5 gal/h based on how you lean.
 
As the POH tells you, best power is based on an EGT of 100° ROP and is mainly used for high power settings (about 75% power). Best economy is mainly for settings below 75% to get low fuel consumption.

As @Tusayan said, it's a bit of an inaccuracy to imply that you are going to get the same percentage of the total available 180 SL HP at both settings.

Personally, unless I'm in a hurry, I use the economy setting as my target. I don't even bother with Lean Assist. Just use the old school method of leaning to engine roughness and then increasing to smoothness. That results in the best economy setting.

At 5000’ MSL, at standard temps, to get 65% Takeoff Power, I need to 2200 RPMs at 23.1 inhg manifold pressure. But what fuel flow is that??
You can play interpolation games but, ultimately, these are general guidelines, not specific settings. If I lean to bet economy with that power setting , I'll get about 8.2; if I lean to 100° ROP, I'll get about 9.5. Not any different than with a fixed pitch prop.
 
Last edited:
I’m trying to do some fuel calc for my first cross country in a DA40 with a constant prop and mixture + prop speed + throttle controls.

From my fixed prop training, I had associated a specific RPM with a fuel flow.

But this chart seems to suggest that you can get different flow rates at the same RPM setting in a certain percent-of-takeoff-power?

How do I know which flow to use?

Example:

At 5000’ MSL, at standard temps, to get 65% Takeoff Power, I need to 2200 RPMs at 23.1 inhg manifold pressure. But what fuel flow is that??

Ignoring the mixture for the moment...

The FP model is pretty simple: more rpm = more power = more fuel flow, and there is a single throttle setting that yields the desired power setting.

For CS, now you have a continuous family of MP/RPM combinations that yield the desired power setting. Since, in general, as rpm increases, fuel flow increases, one power setting may correspond to multiple fuel flow solutions, and they're all correct.

So, we set it to 23.1" and 2200 rpm, and now we start pulling the red knob back, and fuel flow starts going down, first hitting 9.5 gph at best power, and then 8.2 gph at best economy.

"But wait, if we started at 65% power, best power should give me MORE power than 65%, and best economy should give me LESS power than 65%!"

Yes, that is true. These tables are designed to be easy to use and are simple models that were drawn with a crayon and cut with an axe. Don't overthink it.

If you're worried about it, plan conservatively and pick the bigger number. Or, if you're a dumb pilot like me, use my handy patented decoder ring:
O200=6gph
O320=8gph
O360=10gph
O470=12gph

I had the same question a decade ago...
 
Last edited:
A few different things going on.

First is difference between fixed pitch and constant speed props, and what RPM tells you for each.

With a fixed pitch prop, when you add power, the prop turns faster. When you reduce power, the prop turns slower. So RPM directly indicates power output. That is why fixed pitch aircraft usually do not have a manifold pressure gauge. You don't need it.

With a constant speed prop, when you add power, the prop blades increase pitch to maintain RPM. When you reduce power, the prop blades decrease pitch to maintain the RPM. So RPM tells you nothing by itself. COMBINED with MP, it tells you power output. That is why you need a table, and that table includes multiple entries for varying combinations of MP and RPM.

Second is different methods of leaning. Leaner mixture is more efficient, but produces less power. Richer mixture produces more power, but is less efficient. Hence Best Economy and Best Power. Your POH should provide instructions for how to lean using both methods.

To use the table, determine the altitude you want to fly at, and the leaning method you want to use. Select an RPM/MP combination that provides the desired power, and read the fuel flow corresponding to the leaning method. That is your planning figure.

Pro tip: you probably have a fancy engine monitor that gives you % power. If so, don't worry about the table. Just set cruise RPM as desired, adjust MP to desired % power, then lean for power or economy as desired and verify it matches your planning figure.
 
In a fixed pitch prop, i thought you leaned for both because a leaner mixture, at say 5000, increases rpm which means to me, and increase in power.
They are two different mixture settings, which is why the chart shows different fuel flows for them.

Best power will be leaned for max rpm with a fixed pitch prop. Best economy will be slightly leaner…less power, but better fuel economy.

And just to clarify, the selected RPM is where you end up after leaning, not where you start leaning. Puttingsome totally made-up numbers on it, let’s say you set 2200 rpm and then start leaning. When the rpm peaks at maybe 2210, you’re at best power. As you continue leaning, you might get to best economy at 2190. Neither of those is 2200, so if you want 2200, you’d need to start slightly below 2200 to get best power at 2200, or slightly above 2200 to get best economy at 2200. We don’t normally worry about that 10 rpm difference, but that’s how you’d end up with two different fuel flows for the same RPM and percent power.
 
Last edited:
BTW, in terms of doing fuel calcs for planning purposes (checkrides aside), unless weight an balance makes it necessary to dive deeper, I base my fuel calcs and personal reserve minimums on the worst book fuel burn. I'd rather be surprised in a good way.
 
Thanks to everyone who replied to this thread. I appreciate the community’s collective wisdom and practicality!

The table is not completely accurate as variation of mixture at a given RPM and MP will result in variations of percentage power.

As the POH tells you, best power is based on an EGT of 100° ROP and is mainly used for high power settings (about 75% power).


You can play interpolation games but, ultimately, these are general guidelines, not specific settings. If I lean to bet economy with that power setting , I'll get about 8.2; if I lean to 100° ROP, I'll get about 9.5. Not any different than with a fixed pitch prop.

So, we set it to 23.1" and 2200 rpm, and now we start pulling the red knob back, and fuel flow starts going down, first hitting 9.5 gph at best power, and then 8.2 gph at best economy.

"But wait, if we started at 65% power, best power should give me MORE power than 65%, and best economy should give me LESS power than 65%!"

Yes, that is true. These tables are designed to be easy to use and are simple models that were drawn with a crayon and cut with an axe. Don't overthink it.


I had the same question a decade ago...
^lol this is EXACTLY what I was thinking!!

And just to clarify, the selected RPM is where you end up after leaning, not where you start leaning. Putting some totally made-up numbers on it, let’s say you set 2200 rpm and then start leaning. … We don’t normally worry about that 10 rpm difference, but that’s how you’d end up with two different fuel flows for the same RPM and percent power.
 
I’m going up with a CFI in a DA40 this afternoon. It will be just around 15°C and our altimeter 30.00 so it’s a good chance to see if these setting results in the KIAS modeled by the POH charts! There’s also no table for climb rates and fuel consumption at max continuous power by altitude, so I’m really curious about recording that.

Ultimately ±2hrs and ±50RPM or ±1”MP isn’t going to affect my flight planning margins. But I do have fun being a scientist :)
 
Back
Top