

- Joined
- May 25, 2006
- Messages
- 22,014
- Location
- KTTA, North Carolina
- Display Name
- Who you kiddin?
- Home Airfield
- KTTA
I'm sure this has come up from time to time but I figure there may be something new. The real-world accuracy of the book numbers aside, has anyone found a way to convert takeoff performance graphs into a spreadsheet or a Cessna-style table? (And no, don't tell me about spending an extra $100 on ForeFlight for the bizjet package.)
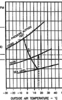
Here's an example. This is the airport altitude/temperature end of a Mooney Ovation (1st Gen) takeoff performance chart. Short or printing it out and adding a whole bunch of extra gridlines, entering an airport altitude of, say, 250' msl is close to a crapshoot; nothing more than a WAG. There's gotta be a better way to do these.
Here's an example. This is the airport altitude/temperature end of a Mooney Ovation (1st Gen) takeoff performance chart. Short or printing it out and adding a whole bunch of extra gridlines, entering an airport altitude of, say, 250' msl is close to a crapshoot; nothing more than a WAG. There's gotta be a better way to do these.


