wanttaja
Final Approach
- Joined
- Jun 7, 2008
- Messages
- 5,667
- Location
- "War-Torn" Portland
- Display Name
- Ron Wanttaja
- Home Airfield
- Twin Oaks Airpark



How'd you like my 40' runway? 10c is 36' and the flight school there is slammed. I did most of my landings for ppl at those 2 widths.It would be labor intensive, but an average number of operations per airport would get the percentages more accurate?
Do you think pilots see “big runway” and just relax a bit too much?

Was flying right seat in a T-18 with the older owner. On final, he was well off the centerline...I was often surprised when we changed to the 75 foot wide cross wind runway that they still landed very near the edge.
Or maybe pilots who struggle with control gravitate towards wider (and longer) runways, so the percentage of questionable landings without an excursion is larger yet?Do you think pilots see “big runway” and just relax a bit too much?


Most videos I’ve seen here… Pilot can’t se to land in centerline.
For that matter, they can’t even take off of centerline.
Which shouldn’t be an issue. If it’s too crappy to land, they shouldn’t be landing.Another issue is weather. No one is doing low instrument approaches in a pouring rain with terrible braking reports on to a 2500 x 25 runway.


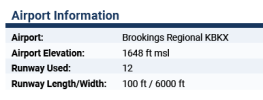
All part of the fun-and-games of working with database information input by humans. CEN23LA175, for example, lists the runway as 100 feet long and 6,000 feet wide.Landed on an incredibly wide runway the other day. It was only 150' long though, so that was challenging.
I used to have copilots who got ****ed off because I wouldn’t let them land on a 50-ft-wide taxiway with a dogleg when they couldn’t keep the ailerons on opposite sides of the centerline anywhere else.When I was instructing, despite having 150 foot wide runways, I always taught and expected centerline between the mains. Then the width of the runway is irrelevant.
Our local DPE expressed amazement at how all my PP candidates could maintain the centerline.

...
Any more thoughts?
...

This. To test the null hypothesis--that excursions are equally likely on any size runway, you have to know the percentage of operations on each runway width. An excursion might be 100x more likely on a 25' wide runway, but if there are 10,000x operations on 150' wide runways, the data could look like that.No solid conclusions can be drawn from these data. Needs to be normalized for usage within each width range.
Even if you normalize by the amount of runways in each range, it changes the ratio. There are a lot more 71-85’ wide runways than any other width.
Nonetheless, I’d hypothesize that use, especially by flight training, would increase the ratio in that range.

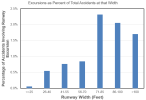
I think you are missing what the chart is showing. It is showing runway excursions as a percentage of total accidents. This should normalize the data for total number of flights, unless of course airports with large runways are safer in every way except for runway excursions.This. To test the null hypothesis--that excursions are equally likely on any size runway, you have to know the percentage of operations on each runway width. An excursion might be 100x more likely on a 25' wide runway, but if there are 10,000x operations on 150' wide runways, the data could look like that.
Plus the reporting issue.
AMEN and of course!I think you are missing what the chart is showing. It is showing runway excursions as a percentage of total accidents. This should normalize the data for total number of flights, unless of course airports with large runways are safer in every way except for runway excursions.
I wonder how often there are runway excursions that would have been prevented by another 10 feet of width? I know very little about runway excursions, thank God, but YouTube is full of examples where it was going to take a lot more than a few more feet ...

I don’t think it’s weird at all. I would expect that. Plenty of width means you can afford to be looser. So we are. Narrow naturally focuses us. There are probably hundreds if not thousands of examples both in and out of aviation.How does the width of the runway factor into runway excursions? Seems like the narrower the runway, the more excursions should occur.
The weird thing is, the data doesn't seem to support that hypothesis
1. Download the NTSB data from:I have some thoughts but would need to look at this more in depth. How would I recreate the dataset myself?

As a short-cut, I've uploaded my basic Excel excursion-data output to:You can sort this in Access, but I usually just get the raw data out and import it to Excel.
Yes, that's my basic process...show how often a particular event occurs in relation to the total number of accidents. It's like results showing that 15% of all Cessna 172 accidents involve loss of engine power, vs. 29% of the Lancair accidents. There are three times as many Cessna 172s in the registry than Lancairs, but looking at the percentage of accidents gets around that. Unless there are too few accidents; I generally won't go public on a particular type unless I have at least 50 accidents to look at.I think you are missing what the chart is showing. It is showing runway excursions as a percentage of total accidents. This should normalize the data for total number of flights, unless of course airports with large runways are safer in every way except for runway excursions.

The issue is that the data aren’t normalized for usage. You could have one 40 foot runway and twenty 75 foot runways in the US and it’d stand to reason that because more 75’ runways exist, you’ll see a higher incidence count on those runways because it’s reasonable to presume there’s more overall use. That’s not an accurate measure, either, because the one 40’ runway might actually be used 100x as much as the 75’ runways. I’m just pointing out the flaw in the study.Yes, that's my basic process...show how often a particular event occurs in relation to the total number of accidents. It's like results showing that 15% of all Cessna 172 accidents involve loss of engine power, vs. 29% of the Lancair accidents. There are three times as many Cessna 172s in the registry than Lancairs, but looking at the percentage of accidents gets around that. Unless there are too few accidents; I generally won't go public on a particular type unless I have at least 50 accidents to look at.
However, in retrospect, I'm not sure this approach is the best one for excursion data. My process includes only accidents where the runway data is available, which is only about half the total number of accidents for the time period. I wonder if that's over-emphasizing the excursion data; are the NTSB investigators not bothering to record the runway dimensions in cases where it didn't matter, which would affect the results.
This is why I post results like this to POA; gives me a bit of a peer review and I get suggestions of how the analysis could be improved or where problems might exist. Rather than use this is as a basis for a later formal article, I'll just leave it here as a curiosity.
Besides, the basic problem still exists: The non-intuitive result that says the rate of excursions decreases with runway width. Don't get me wrong, I *love* non-intuitive results, but I need some logic that leads to the right conclusion.
Ron Wanttaja
There's more than that in the table though, including the "percent of excursions" column.I think you are missing what the chart is showing. It is showing runway excursions as a percentage of total accidents.
Nope. It normalizes the data for the number of accidents on that width of runway. The question this math would attempt to answer is, "If there's an accident on an x' wide runway, what is the likelihood that it is an excursion?" But there's a lot of confounding, even to answer that question.This should normalize the data for total number of flights, unless of course airports with large runways are safer in every way except for runway excursions.
Maybe people getting a bit lazy on speed and centerline at bigger runways? I have done all my training at a 12,000-foot, 200-foot wide runway. My first instructor said we could do touch and goes without turning. But I’ve seen people go off the sides in GA planes.One of the features of the NTSB accident database is that it lists the various occurrences that happen during each accidents. Here are the flags for a number of accidents where the aircraft departs the runway:
After landing Runway excursionLanding Runway excursionLanding-aborted after touchdown Runway excursionLanding-flare/touchdown Runway excursionLanding-landing roll Runway excursionOther Runway excursionTakeoff Runway excursionTakeoff-rejected takeoff Runway excursionUnknown Runway excursionRecently, I realized that the dimensions of the runways involved were often included the database. Which leads to the question:
How does the width of the runway factor into runway excursions? Seems like the narrower the runway, the more excursions should occur.
The weird thing is, the data doesn't seem to support that hypothesis. I divided the runway width into six categories, counted the excursions involved in each category, and divided it by the number of total accidents for each category.
View attachment 152027
Note that the percentage is the percentage of accidents at that runway width...yes, there are more landings (and accidents) on 75-foot-wide runways, but we're looking at the percentage of events at that size.
For me, this is a non-intuitive result... it doesn't seem reasonable. I can think of a few reasons for this...for instance, Flight Schools are probably more likely to be using the wider runways, so that student excursions make up more of the activity on the 70+ runways. Seems like classic taildraggers would probably have more experienced pilots, but the results for the production taildraggers is practically the same as above. The analysis doesn't take the runway *length* into consideration, either...some of those excursions could be off the end, rather than off the side.
Any more thoughts?
Ron Wanttaja