
wanttaja
Final Approach
- Joined
- Jun 7, 2008
- Messages
- 5,667
- Location
- "War-Torn" Portland
- Display Name
- Ron Wanttaja
- Home Airfield
- Twin Oaks Airpark
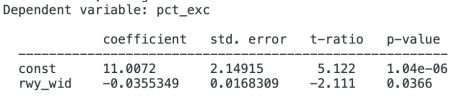
I'm going to discuss the methodology a bit more.
Ideally, we'd have a list of how many operations are performed per day for each runway, for which you could compare the number of excursion accidents and the width of the runway to come up with a simple percentage...
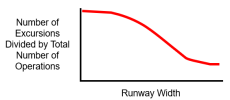
The trouble is, the DATA to perform these calculations just don't exist. Oh, I'm sure that the FAA has data for the major airports. But they probably aren't collecting it for the smaller ones. So we have no way to calculate what percentage of landings result in a landing excursions at a bevy of 25 to 50-foot-wide runways.
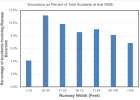
So, how else to do it? Instead, let's take the accident including excursions that occurred on runways of a given width, and divide by the total number of ACCIDENTS that happened on runways of that width. If there were ten excursions for 100 total accidents at a runway 40 feet wide and 100 excursions out of 1500 accidents on a runway 75 feet wide, the wider runway obviously sees fewer excursions.
(note that, as MidwestPa24 point out, the NTSB parameter doesn't differentiate between an excursion to the side or off the far end.)
We'd all love to know the rate of excursions vs. the number of operations, but the data just isn't there. One can imagine the owners of smaller airports rejecting FAA attempts to gather such information.
So, the best chance of reliable data is to compare the number of excursions vs. the accidents that happened on the runways of that width.
A good example of why one uses this process comes from my analysis of homebuilt aircraft accidents. People want to know how reliable auto engine conversions are. So, take the total number of accidents affecting a given engine, and divide by the number of engines in service.
One problem there: We don't know how many engines of a given type are installed on homebuilt aircraft. The FAA registry includes the engine make/model, but about 1/6th of the EAB entries don't list a specific engine.
And it's oh-so-easy for an auto engine converter to claim that that 1/6th of the homebuilt fleet consists of aircraft carrying his own engine.
So...instead, I compute how many accidents occur to homebuilts with that engine that were due to engine issues, and divide it by the total number of homebuilts carrying that engine that had accidents for ANY reason.
I do THAT, and I get results like this:
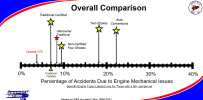
I was surprised when two-stroke engines actually came out a bit better than auto conversions, but most of those two-strokes are designed for aviation usage...no conversion required.
This depiction does tend to throw people off: "You mean that 22% of auto engines FAIL????" No, not at all. 22% of accidents that occur to auto-engined homebuilts were due to mechanical issues with the engine. Not the same thing.
But people want to see this data depicted as the percentage of the overall fleet.
And I have made such calculations. I have estimated the percentage of the non-labeled engines in the US fleet that are actually Continentals, VWs, etc. and computed an estimated annual failure rate. Didn't run it for all engines, but the gamut runs from 0.013% failure rate per year for Continental A65 engines, to 0.245% for Rotax 582 (two strokes).
But...it's got a whole lot of estimation involved. The maker of a given engine type could claim that my estimation process shorted their engine, somehow, and I wouldn't have much to counter them.
So, I'm sticking with the "# of accidents of a given condition" divided by the "total number of accidents" for now.
Ron Wanttaja
Ideally, we'd have a list of how many operations are performed per day for each runway, for which you could compare the number of excursion accidents and the width of the runway to come up with a simple percentage...
The trouble is, the DATA to perform these calculations just don't exist. Oh, I'm sure that the FAA has data for the major airports. But they probably aren't collecting it for the smaller ones. So we have no way to calculate what percentage of landings result in a landing excursions at a bevy of 25 to 50-foot-wide runways.
So, how else to do it? Instead, let's take the accident including excursions that occurred on runways of a given width, and divide by the total number of ACCIDENTS that happened on runways of that width. If there were ten excursions for 100 total accidents at a runway 40 feet wide and 100 excursions out of 1500 accidents on a runway 75 feet wide, the wider runway obviously sees fewer excursions.
(note that, as MidwestPa24 point out, the NTSB parameter doesn't differentiate between an excursion to the side or off the far end.)
We'd all love to know the rate of excursions vs. the number of operations, but the data just isn't there. One can imagine the owners of smaller airports rejecting FAA attempts to gather such information.
So, the best chance of reliable data is to compare the number of excursions vs. the accidents that happened on the runways of that width.
A good example of why one uses this process comes from my analysis of homebuilt aircraft accidents. People want to know how reliable auto engine conversions are. So, take the total number of accidents affecting a given engine, and divide by the number of engines in service.
One problem there: We don't know how many engines of a given type are installed on homebuilt aircraft. The FAA registry includes the engine make/model, but about 1/6th of the EAB entries don't list a specific engine.
And it's oh-so-easy for an auto engine converter to claim that that 1/6th of the homebuilt fleet consists of aircraft carrying his own engine.
So...instead, I compute how many accidents occur to homebuilts with that engine that were due to engine issues, and divide it by the total number of homebuilts carrying that engine that had accidents for ANY reason.
I do THAT, and I get results like this:
I was surprised when two-stroke engines actually came out a bit better than auto conversions, but most of those two-strokes are designed for aviation usage...no conversion required.
This depiction does tend to throw people off: "You mean that 22% of auto engines FAIL????" No, not at all. 22% of accidents that occur to auto-engined homebuilts were due to mechanical issues with the engine. Not the same thing.
But people want to see this data depicted as the percentage of the overall fleet.
And I have made such calculations. I have estimated the percentage of the non-labeled engines in the US fleet that are actually Continentals, VWs, etc. and computed an estimated annual failure rate. Didn't run it for all engines, but the gamut runs from 0.013% failure rate per year for Continental A65 engines, to 0.245% for Rotax 582 (two strokes).
But...it's got a whole lot of estimation involved. The maker of a given engine type could claim that my estimation process shorted their engine, somehow, and I wouldn't have much to counter them.
So, I'm sticking with the "# of accidents of a given condition" divided by the "total number of accidents" for now.
Ron Wanttaja