It did for me. If I did KRIC-FAK-KMEM it dropped the FAK waypoint about 4 mm too low on the map. If I did KRIC-FAK-KROA
Actually, you'd be surprised. The code to read GEOTIFFS (which is what these sectionals are published by the FAA in) is pretty much the same, all based on the TIFF reader written by Sam Leffler at SGI with the GEOTIFF add ons by Niles Ritter and Frank Warmerdam with the tables borrowed from EPSG). The actual transformation code is almost certainly the government furnished PROG4 which just about every product out there be it commerical or open source uses.
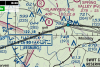
The FAA IFR charts are not conformal because they don't expect you to put a plotter to the thing to compute angles but rather to just use the airways. The sectionals and WACs are indeed lambert conformal conics. The FAA IFR enroutes are in mercator projection (note I believe that Jepp uses lambert conformal even for the enroutes).

 Like you expect to be right on the centerline.
 ")