Accident Rates for Common GA Aircraft

wanttaja

En-Route
Joined
Jun 7, 2008
Messages
4,578
Location
Seattle
Display Name

Display name:
Ron Wanttaja
Well, as promised (threatened?) here's the result of attempting to compute the Fleet Accident Rate for several common aircraft.

I used the NTSB accident database, for the period from January 1 2010 to December 1 2016. I computed a fleet size for each aircraft based on the January 1 2017 FAA registration database, computed the annual number of accidents, then divided the number of accidents by the fleet size to get the fleet rate.

While this is kind of a bastard approach, the key thing is comparing the different aircraft. What they're compared to isn't as important.
rate.jpg

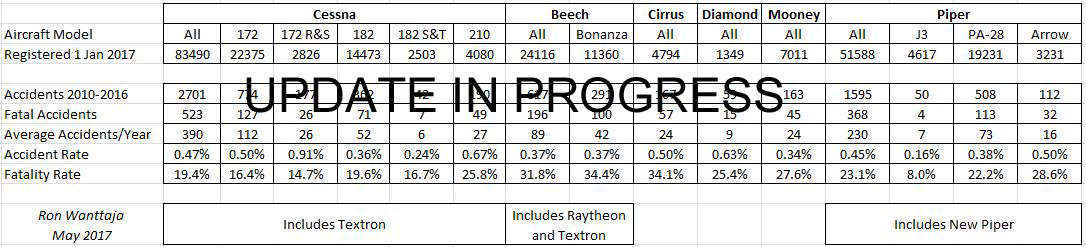
The "Accident Rate" is the average percent of that model of aircraft that have an accident in any give year. Low is good. The "Fatality Rate" is the percentage of accidents that result in at least one fatality. Again, low is good.

If I discover a way to build tables on POA, I'll replace this image with a table.

I'll be happy to correct this if anyone finds problems with the statistics.

Edit: Table updated. See:
Accident Rates for Common GA Aircraft

Ron Wanttaja
 
Last edited:
Looks like the J3 was the pinnacle of aviation safety. Who'da thunk it?
 
That's odd to me. I've just heard over and over about the safety of the diamonds.
Thank you for that info.
 
Of course the missing and hard to get info is how much each fleet flies in hours each year...

So for instance if Diamonds are weighted toward flight schools, and flight schools fly more hours per airframe than private owners, that ups the accident exposure.

It's just hard data to get.


Sent from my iPhone using Tapatalk
 
Agreed. The fatality percentage is what was most shocking for the diamonds. I had heard quite the opposite...that they were probably the lowest fatality rate of all. Could just be marketing though
 
Also trainers in general will have a lower fatal rate, for a couple of reasons. The higher fatality rates seem to correlate to traveling airplanes - where weather starts to bite..

Glad to see that Mooney looks pretty good against the traveling airplanes. Reinforces the stats I've seen previously....

Sent from my iPhone using Tapatalk
 
J-3 is barely fast enough to kill you.
J-3 is also an older design whose fleet size may have a lot of inactive aircraft. This will skew the results.

As I mentioned in an earlier post, the re-registration program is helping this to some extent. I've found a significant difference in the fleet accident rate for given homebuilt designs, after 25% of the fleet was deregistered.

That's odd to me. I've just heard over and over about the safety of the diamonds.

One of the results that gave me a bit of a pause. I found about 1350 Diamond aircraft in the FAA registry; if something says there are a lot more of them, let me know.

Ron Wanttaja
 
Another factor re Diamond is the small statistical base. Generally, I don't run fleet rate statistics unless I have at least 50 accidents to work on, and the Diamond has only 59.

Also, this is a shorter time period (6.92 years) than I normally work to. I was running it back 20 years, but newer aircraft (Cirrus/Diamond) come out better since they haven't been operational through that period.

Ron Wanttaja
 
Very interesting information. What I am wondering about is how many of the accidents were attributed to the pilot error? I could imagine that the lower accident rate for 182 was at least partially attributed to higher standards of the pilots flying this aircraft.
 
You missed PA32's those are common planes.
 
Nope, didn't miss it - what I was trying to say was the lack of information. I would add here pilot TT/machine age information in this table (at least averages, even that would help somewhat)
 
Very interesting information. What I am wondering about is how many of the accidents were attributed to the pilot error? I could imagine that the lower accident rate for 182 was at least partially attributed to higher standards of the pilots flying this aircraft.

The Nall report I believe tries to dig into accident causes, but it's tricky to try and tease apart pilot community from type. I do suspect that pilot communities and their experience really do vary significantly....

https://www.aopa.org/training-and-safety/air-safety-institute/accident-analysis/joseph-t-nall-report


Sent from my iPhone using Tapatalk
 
Wonder why the 150/152 was not included with Cessna. The fatal accident rate has been for sometime the best being the 172, followed by the 150 then the 182. Also heard Mike Busch on a EAA Webinar say that minus corrosion problems the high wing Cessna's with struts can last a long time - think he said forever - an obvious hyperbole.
 
Just from the glance on Nall report: 64-74% of the acidents are pilot-related. That by itself already gives a bit of a food for thought.
 
Seems to be a rough correlation between stall speed/performance and fatal accident rate.
 
Last edited:
... Also heard Mike Busch on a EAA Webinar say that minus corrosion problems the high wing Cessna's with struts can last a long time - think he said forever - an obvious hyperbole.

So does that mean a corrosion free Cessna with struts will keep a POAer going...ahem...ever skyward?
 
Last edited:
Just from the glance on Nall report: 64-74% of the acidents are pilot-related. That by itself already gives a bit of a food for thought.

It's true. It means we can all control a lot.

But there are correlations that are noteworthy - traveling types get into more weather problems. Trainers will have more minor accidents, fewer fatals. Or some types are known for experienced pilots, or a high percentage of instrument rated pilots. Others might skew to lower hour pilots. And finally there is airframe stability, strength, chute saves, ease of handling, higher performance engines, retractable gear, etc. all influencing numbers, even though many of the accidents still are "pilot error"....


Sent from my iPhone using Tapatalk
 
Looks like the J3 was the pinnacle of aviation safety. Who'da thunk it?
I'll bet the J3 has a lower usage rate. A Cub won't register in the stats if it never leaves the hangar.
 
On that same Webinar Mike mentioned corrosion problems with aircraft based in Florida and the Gulf coast. His company does pre buy inspections and they have found corrosion on Cirrus aircraft(metal parts) based in Florida. Most Cessna aircraft built before 1998 came with no corrion protection but he said current Cessna aircraft have the best corrosion protection in the industry.
 
I'll bet the J3 has a lower usage rate. A Cub won't register in the stats if it never leaves the hangar.

The thread with all the abandoned and unloved airplanes didn't have a single J3 example as I recall. I'll bet there's far more registered Cessna 172s, Cherokee 140s and the like not being flown.
 
I used the NTSB accident database, for the period from January 1 2010 to December 1 2016. I computed a fleet size for each aircraft based on the January 1 2017 FAA registration database, computed the annual number of accidents, then divided the number of accidents by the fleet size to get the fleet rate.

No way to compute against hours flown? Kind of limited usefulness without that piece.
 
The Cirrus isn't *quite* the Dr killer its supposed to be, but it's pretty close.
 
Wonder why the 150/152 was not included with Cessna.
The driving factor behind this analysis was discussion in another thread regarding Cirrus vs. Mooney. So the primary target of the analysis was to get determine the relative statistics for more-complex cross-country type machines. This has a second advantage in that the annual flight hours between these types is probably roughly the same, so it minimizes the differences due to different utilization rates.

The J-3 is there because I already had an Access filter to provide the fleet size.

Very interesting information. What I am wondering about is how many of the accidents were attributed to the pilot error? I could imagine that the lower accident rate for 182 was at least partially attributed to higher standards of the pilots flying this aircraft.
I have looked at pilot factors as part of my "homebuilts vs. production" accident statistics analyses. The Cessna 172 is relatively high as far as stick-and-rudder control issues, but the median pilot time is pretty low, about 450 hours (vs. a thousand for the typical homebuilts). I have previously posted charts showing the relative occurrence of given accident causes across several homebuilt and production types.

Ron Wanttaja
 
The Cirrus isn't *quite* the Dr killer its supposed to be, but it's pretty close.

But the trend line for Cirrus fatals has been declining since they stepped up their training emphasis.

I think it's another example of the same lesson learned years ago with the Mitsubishi MU-2

IMG_0249.PNG
 
Last edited:
No way to compute against hours flown? Kind of limited usefulness without that piece.
Will someone who owns a Cirrus fly more than someone who flies a Mooney? I would assume the flight hours are probably roughly the same to perform the same mission. The point of the above analysis is not to come up with an absolute reference of safety, but to allow one to compare several aircraft that perform the same mission.

Ron Wanttaja
 
No. Cirrus is faster :)

If you're computing accidents per hour, then you'd expect the Mooney to be higher since it's faster, and goes further per unit time.

But maybe it's counterbalanced by Mooney pilots flying the same distances in shorter time frames ;)


Sent from my iPhone using Tapatalk
 
But the trend line for Cirrus fatals has been declining since they stepped up their training emphasis.
Here's the number of Cirrus accidents per year since 1999:

1999: 1
2000: 0
2001: 4
2002: 6
2003: 6
2004: 10
2005: 15
2006: 26
2007: 21
2008: 23
2009: 26
2010: 26
2011: 31
2012: 23
2013: 25
2014: 19
2015: 20

I'm too lazy right now to dig up the total aircraft registered per year, but it appears that the total accidents peaked around 2011. The decline in the number of accidents per year since, despite the addition of ~300 new aircraft per year, is an indication that SOMEthing worked....

Ron Wanttaja
 
Pretty small statistical universe, no way to know hours flown by model. . .just not a lot to draw conclusions from.
 
Here's the number of Cirrus accidents per year since 1999:

1999: 1
2000: 0
2001: 4
2002: 6
2003: 6
2004: 10
2005: 15
2006: 26
2007: 21
2008: 23
2009: 26
2010: 26
2011: 31
2012: 23
2013: 25
2014: 19
2015: 20

I'm too lazy right now to dig up the total aircraft registered per year, but it appears that the total accidents peaked around 2011. The decline in the number of accidents per year since, despite the addition of ~300 new aircraft per year, is an indication that SOMEthing worked....

Ron Wanttaja

I think you might be understating the accident rate for newer planes like Cirrus where the installed base grew materially during the study period (10-16). Unlike something like Mooney where the installed base may not have changed significantly over that period and the 1/17 registrations are a good proxy for the installed base over the period.

If ~300 Cirrus are built each year and 4800 are registered in January 2017, that might suggest only 2700 were registered on January 2010.

Cirrus sold just over 4900 airplanes total between introduction in 1999 and the end of 2010. Of those almost 75% were SR22s.

Looks like in any given year about 40% +/- of the piston production gets exported, so your estimate of the domestic fleet of Cirrus aircraft in 2010 seems reasonable.
 
Last edited:
Looking it over the one that stands out for me is the Bonanza fatality rate. Wowzers. That's an airplane that usually isn't flown by low timers, and yeah, probably many do more IMC than some of the others, but holy cow man.

That fatality rate is pretty high.

Some of that I can see where it comes from -- there's a pretty tight correlation with landing speed and fatality rate on your chart.

Hit things fast, you die. But everyone always says they want no-flap landings in everything because they "feel like they have more control in gusts" and what-not. (Another topic, we've covered that one before.)

But... that Bonanza rate bugs me a bit.

Especially considering they're another group that has upped their game on training and proficiency quite a bit through type organizations since my early days of flying.

And this is all 2000's era data.

What the heck are you Bo drivers doing?! ;)
 
Back
Top