Jim_R
Pattern Altitude
- Joined
- Feb 17, 2010
- Messages
- 1,883
- Display Name
Display name:
Jim
At my annual this year, we installed an Insight G3 engine monitor on my PA28-180 (Lycoming O360-A4A). I've been collecting and reviewing data post-flight, and there's a signature on cylinder 1 that I don't understand.
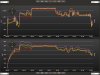
On my engine, cylinder 1 is farthest forward, then 2-3-4 towards the aft. It's pretty intuitive that cyl 1 would run coolest, with temps increasing to a max at cyl 4. Often, that's exactly what I see in the data, and each cylinder follows a very similar temp profile, just offset from each other with cyl 1 on the bottom and cyl 4 on top of the graph.
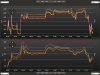
However, many of the plots show an odd signature on cylinder 1 when power is applied. Instead of temps ramping up with the other cylinders, they dip. This only seems to occur in flight, never during run-ups on the ground.
I am not sure how to interpret this. I think that's an indication the cylinder is running rich, so perhaps a plug misfire?
How should I troubleshoot this? Should I swap plugs to another cylinder and see if the behavior follows? (Should I swap top and bottom plugs to different cylinders to better see if it follows one or the other?)
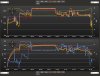
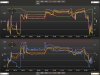
Here are two graphs. First one is what I consider a "normal" profile. Second shows the unexpected cylinder 1 behavior. (Graphs 3 and 4 are the same as 1 and 2, but with manifold pressure (which just shows altitude changes since it's a constant-pitch prop) and fuel flow shown to better illustrate engine load.)
I think I've seen in the past where folks have suggested workshops or other methods to better learn how to use/interpret EM data. I'd appreciate a reminder of those!
On my engine, cylinder 1 is farthest forward, then 2-3-4 towards the aft. It's pretty intuitive that cyl 1 would run coolest, with temps increasing to a max at cyl 4. Often, that's exactly what I see in the data, and each cylinder follows a very similar temp profile, just offset from each other with cyl 1 on the bottom and cyl 4 on top of the graph.
However, many of the plots show an odd signature on cylinder 1 when power is applied. Instead of temps ramping up with the other cylinders, they dip. This only seems to occur in flight, never during run-ups on the ground.
I am not sure how to interpret this. I think that's an indication the cylinder is running rich, so perhaps a plug misfire?
How should I troubleshoot this? Should I swap plugs to another cylinder and see if the behavior follows? (Should I swap top and bottom plugs to different cylinders to better see if it follows one or the other?)
Here are two graphs. First one is what I consider a "normal" profile. Second shows the unexpected cylinder 1 behavior. (Graphs 3 and 4 are the same as 1 and 2, but with manifold pressure (which just shows altitude changes since it's a constant-pitch prop) and fuel flow shown to better illustrate engine load.)
I think I've seen in the past where folks have suggested workshops or other methods to better learn how to use/interpret EM data. I'd appreciate a reminder of those!
Attachments
Last edited:
")