George Chityat
Pre-Flight
- Joined
- Dec 15, 2016
- Messages
- 63
- Display Name
Display name:
george99
Please see attached photo.
I could not wrap my head around this one yet. Maybe someone here can explain it and it will click for me.
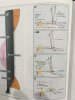
Look on the right in figure B.
The red line in the middle goes thru the center of pressure.the green Lift line comes out of the center of pressure too. The dashed blue line which represents drag and together with lift forms a rectangle for TAF.
The question is where does the dashed blue drag line come from? It seems like it just comes off an arbitrary point along solid blue relative wind line. How do you determine where that line goes?
I could not wrap my head around this one yet. Maybe someone here can explain it and it will click for me.
Look on the right in figure B.
The red line in the middle goes thru the center of pressure.the green Lift line comes out of the center of pressure too. The dashed blue line which represents drag and together with lift forms a rectangle for TAF.
The question is where does the dashed blue drag line come from? It seems like it just comes off an arbitrary point along solid blue relative wind line. How do you determine where that line goes?