tonycondon
Gastons CRO (Chief Dinner Reservation Officer)
Heres some pretty pictures. Unfortunately I cant attached my full excel file with all my measured and extrapolated data, plus plots, but ill attach a few interesting plots for your enjoyment.
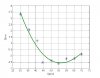
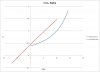
Max L/D came out to 23.5:1 at about 49 mph. First plot is the L/D vs speed curve. This was pretty easy to get to, just took speed and descent rate info straight from my flight test.

To gather the data I mounted a digital video camera behind the pilot seat, trained on the instrument panel. Also had a good view of the outside world.
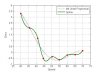
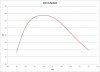
Next is the actual descent rate vs. speed. The 'Polar' for us glider junkies. Minimum sink is about 165 fpm at 42 mph or so. Also direct measured data. The really cool thing is that this matched up really well with theoretical data provided by Stan Hall in the design documents.

From there, I started to come up with some numbers. I used the lift equation (L = 1/2*rho*V^2*S*Cl) to come up with a Coefficient of Lift value at each speed. Similarly used Drag equation (D = 1/2*rho*V^2*S*Cd) and the L/D value to find Cd.
There's an alternative (simplified) equation for Cd.
Cd = Cdo + Cl^2/(pi*e*AR)
e is span efficiency factor (1 for an elliptical wing, a la Spitfire) and AR is aspect ratio.
Cdo is the coefficient of drag at an angle of attack of 0.
I plotted a huge table of Speed vs. e, finding the Cdo value at each combination. From flight performance, at minimum sink speed, Cdo should equal 1/4 Cd. So i generated the next really pretty plot, and found which e value provided a Cdo that equaled 1/4 Cd for that speed. that e value turned out to be .905

so i re-calculated Cd using the Cdo and e value that I had found. It matched up fairly closely.
I also wanted to figure out some angle of attack data. I used a basic stability equation to do so. That is:
Cl = Clo + dCl/dalpha*alpha + dCl/delev*elev
Clo is Cl at 0 angle of attack. dCl/dalpha is the slope of the Cl vs alpha line. dCl/delev is the change in Cl with change in elevator angle. and elev is the elevator angle.
I had meausured the stick position during flight and was able to associate that with an elevator deflection angle. This gave me the last two terms. I got the change in alpha from my video, by measuring the change in pitch attitude between various speeds, and subtracting off the change in flight path angle from my L/D numbers. I then divided this into the change in Cl between the speeds to get the dCl/dalpha value. So i knew everything but alpha and was able to solve for it. Now i could convert speed to alpha. All of this is 1G level flight of course.
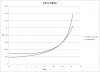
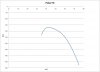
So next is my Cl vs alpha plot, also plotted is the Lockheed plot. difference between a 3D wing with a fuselage and a 2D code, i suppose.

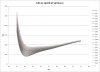
Also the Cd vs alpha plot, with both methods. I think the measured one runs a little higher because it includes the drag from the fuselage. makes sense.

Questions? comments? My presentation is on Thursday afternoon. Ive just got a few more tweaks to do to these plots, then get a powerpoint put together, do some laundry, and get my hair cut
Max L/D came out to 23.5:1 at about 49 mph. First plot is the L/D vs speed curve. This was pretty easy to get to, just took speed and descent rate info straight from my flight test.
To gather the data I mounted a digital video camera behind the pilot seat, trained on the instrument panel. Also had a good view of the outside world.
Next is the actual descent rate vs. speed. The 'Polar' for us glider junkies. Minimum sink is about 165 fpm at 42 mph or so. Also direct measured data. The really cool thing is that this matched up really well with theoretical data provided by Stan Hall in the design documents.
From there, I started to come up with some numbers. I used the lift equation (L = 1/2*rho*V^2*S*Cl) to come up with a Coefficient of Lift value at each speed. Similarly used Drag equation (D = 1/2*rho*V^2*S*Cd) and the L/D value to find Cd.
There's an alternative (simplified) equation for Cd.
Cd = Cdo + Cl^2/(pi*e*AR)
e is span efficiency factor (1 for an elliptical wing, a la Spitfire) and AR is aspect ratio.
Cdo is the coefficient of drag at an angle of attack of 0.
I plotted a huge table of Speed vs. e, finding the Cdo value at each combination. From flight performance, at minimum sink speed, Cdo should equal 1/4 Cd. So i generated the next really pretty plot, and found which e value provided a Cdo that equaled 1/4 Cd for that speed. that e value turned out to be .905
so i re-calculated Cd using the Cdo and e value that I had found. It matched up fairly closely.
I also wanted to figure out some angle of attack data. I used a basic stability equation to do so. That is:
Cl = Clo + dCl/dalpha*alpha + dCl/delev*elev
Clo is Cl at 0 angle of attack. dCl/dalpha is the slope of the Cl vs alpha line. dCl/delev is the change in Cl with change in elevator angle. and elev is the elevator angle.
I had meausured the stick position during flight and was able to associate that with an elevator deflection angle. This gave me the last two terms. I got the change in alpha from my video, by measuring the change in pitch attitude between various speeds, and subtracting off the change in flight path angle from my L/D numbers. I then divided this into the change in Cl between the speeds to get the dCl/dalpha value. So i knew everything but alpha and was able to solve for it. Now i could convert speed to alpha. All of this is 1G level flight of course.
So next is my Cl vs alpha plot, also plotted is the Lockheed plot. difference between a 3D wing with a fuselage and a 2D code, i suppose.
Also the Cd vs alpha plot, with both methods. I think the measured one runs a little higher because it includes the drag from the fuselage. makes sense.
Questions? comments? My presentation is on Thursday afternoon. Ive just got a few more tweaks to do to these plots, then get a powerpoint put together, do some laundry, and get my hair cut
Attachments
Last edited:
")