You are using an out of date browser. It may not display this or other websites correctly.
You should upgrade or use an alternative browser.
You should upgrade or use an alternative browser.
Density ?
- Thread starter marcoseddi
- Start date

On first glance I would say 1400 decrease
marcoseddi
Cleared for Takeoff
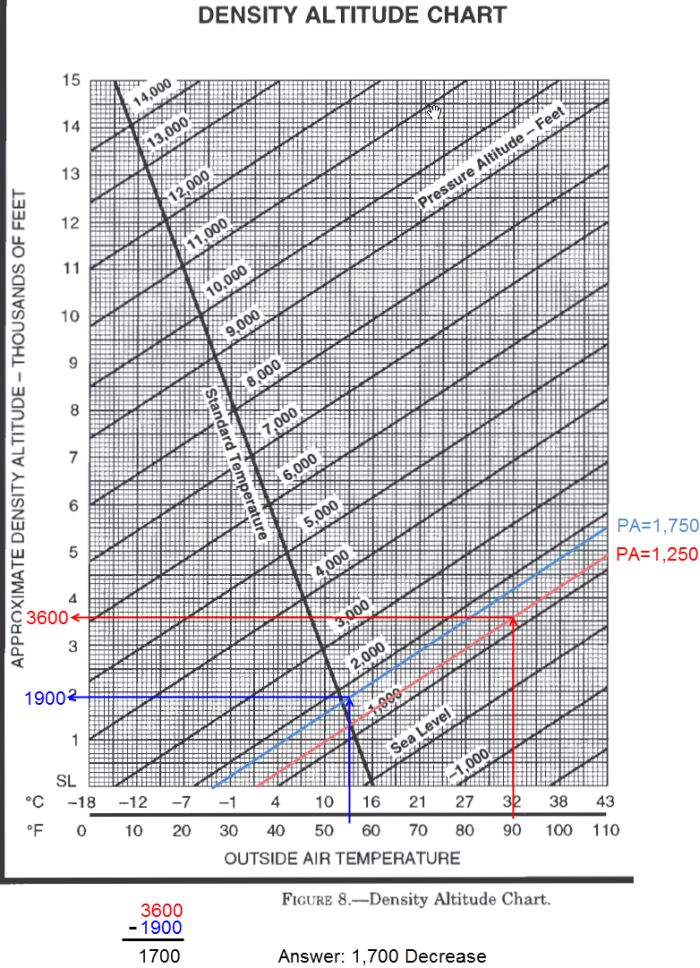
I realized second i posted it and stopped looking at the screen for 3 hours straight its 1700 decrease. Thanks
It probably is..... I always err on the conservative side.
")
poadeleted20
Deleted
- Joined
- Apr 8, 2005
- Messages
- 31,250
The way you compute it is to pull out your whiz wheel and compute the denstity altitude for each temp/PA pair, then pull out your stubby pencil and paper and subtract one from the other.
Bobcat1
Pre-takeoff checklist
- Joined
- Mar 31, 2011
- Messages
- 361
- Display Name
Display name:
Bobcat1
Maybe if we could refer to figure 8, as they mention in the preface to the question, we might get a better idea. Barring that, do what Cap'n Ron mentioned eg: whiz wheel and paper and pencil figuring.
eetrojan
Pattern Altitude
Maybe you guys can help with this question I cant seem to figure out how to compute it.
Hi Marc - There are probably other ways to do it, but this is how I would do it with the actual Figure 8 chart. You have to add your own lines for the pressure altitudes of 1,250 and 1,750 feet, in between 1,000 and 2,000 feet, then it seems pretty straight forward.
It's my understanding that they will give you a clear sheet so that you can draw on top of the chart during the test. Can anybody verify that?
Joe
Last edited: