Calling all chart jockeys

MarcP

Filing Flight Plan
Joined
Jan 26, 2020
Messages
24
Display Name
Marc P
Hello-

I came across the circled symbols in the Flyway chart for the San Francisco. I checked the Chart Users Guide and can't seem to find it listed. Any ideas? It always seems to be on part of an airspace boundary.
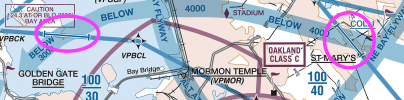
Screenshot 2025-11-21 at 1.34.01 PM.png

Thank you!

Marc
 
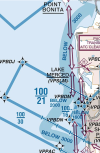
Looking at the chart on skyvector, I think that is denoting an altitude change on the flyway as it crosses various shelf layers of the Class B. I think below is a clearer example. Above and below the 100/21 shelf the flyway is shown "Below 3,000", but under that shelf it is "Below 2,000"

1763761578643.png

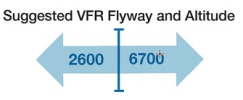
Here is the symbol in the Legend

1763761703668.png
 
Ah, I think the non-perpendicularity + on the boundary threw me. Makes sense!
 
Ah, I think the non-perpendicularity + on the boundary threw me. Makes sense!
You’re not the only one. Particularly in the aeronautical symbols document it has the mileage above it. But the altitude changes on either side makes me think that we've got the correct answer.
 
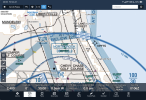
This shot of the Chicago shoreline flyway has the perpendicular marking. The difference might have something to do with the difference in altitude on each side. Dunno. 1763773724732.png
 
I have to say, I've never looked at the SFO Class B airspace before, what a mess!
It was changed about 5 or so years ago. There were problems with Approaches into SFO that would take traffic below the floor of the B. Getting away from the traditional concentric circle model made things a lot more efficient allowing VFR traffic to navigate through the area easier. Check out SEA and SAN/NKX, others that got away from the concentric circle model relatively recently. SAN looks like a mess at first glance but it’s very well designed. LAX did it many years ago.
 
Back
Top