classicrock
Pre-Flight
- Joined
- Aug 18, 2015
- Messages
- 73
- Display Name
Display name:
acousticguitar
as a VFR student pilot (getting close to checkride), I have observed that I may be more conscientious than some when it comes to monitoring weather(previous threads on this website have indicated that some pilots barely even took the time to do so and)
that said, one aviation weather tool that has been mentioned on this website before is the skew T log, which I learned of about 6 months ago.its taken me awhile to learn how to Interpret it, especially the numbers in the upper right corner(Ki Index, Lifting Index, etc). thanks to viewing lots of videos online by Scott Daenstaedt and some slides prepared by Delia Colvin, I have gotten very close knowing which numbers and how the dewpoint/temp spread have to look in order to make the go/no go decision
essentially if the Ki Index is over 26(yellow flag) and definitely over 30 and the dewpoint/spread(red/blues lines)either makes contact in 2 places below 800mb lines or are very close to each other in a 1 hour time period, I will consider a delay. if it is above 26 and the spread stays close,or makes contact for 3 one hour time periods in a row. I cancel.
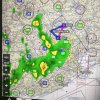
I have attached pics. these are from today. first 3 are the skew t logs. last one is pic of weather taken on Foreflight in airspace near where I fly(KDWH-Tomball Tx).
I want to know how this matches with what other pilots(of those who use skew t logs)reference points on the logs they use
comments?
that said, one aviation weather tool that has been mentioned on this website before is the skew T log, which I learned of about 6 months ago.its taken me awhile to learn how to Interpret it, especially the numbers in the upper right corner(Ki Index, Lifting Index, etc). thanks to viewing lots of videos online by Scott Daenstaedt and some slides prepared by Delia Colvin, I have gotten very close knowing which numbers and how the dewpoint/temp spread have to look in order to make the go/no go decision
essentially if the Ki Index is over 26(yellow flag) and definitely over 30 and the dewpoint/spread(red/blues lines)either makes contact in 2 places below 800mb lines or are very close to each other in a 1 hour time period, I will consider a delay. if it is above 26 and the spread stays close,or makes contact for 3 one hour time periods in a row. I cancel.
I have attached pics. these are from today. first 3 are the skew t logs. last one is pic of weather taken on Foreflight in airspace near where I fly(KDWH-Tomball Tx).
I want to know how this matches with what other pilots(of those who use skew t logs)reference points on the logs they use
comments?
")