Let'sgoflying!
Touchdown! Greaser!
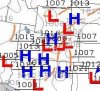
What are the rules about plotting symbols on weather maps? Seems a bit too....individual to me. I can't make h nor t of this pic, got it from the link below a few moments ago:
http://adds.aviationweather.noaa.gov/progs/nav.php?current=0
http://adds.aviationweather.noaa.gov/progs/nav.php?current=0