You are using an out of date browser. It may not display this or other websites correctly.
You should upgrade or use an alternative browser.
You should upgrade or use an alternative browser.
True Airspeed Chart
- Thread starter HF17
- Start date
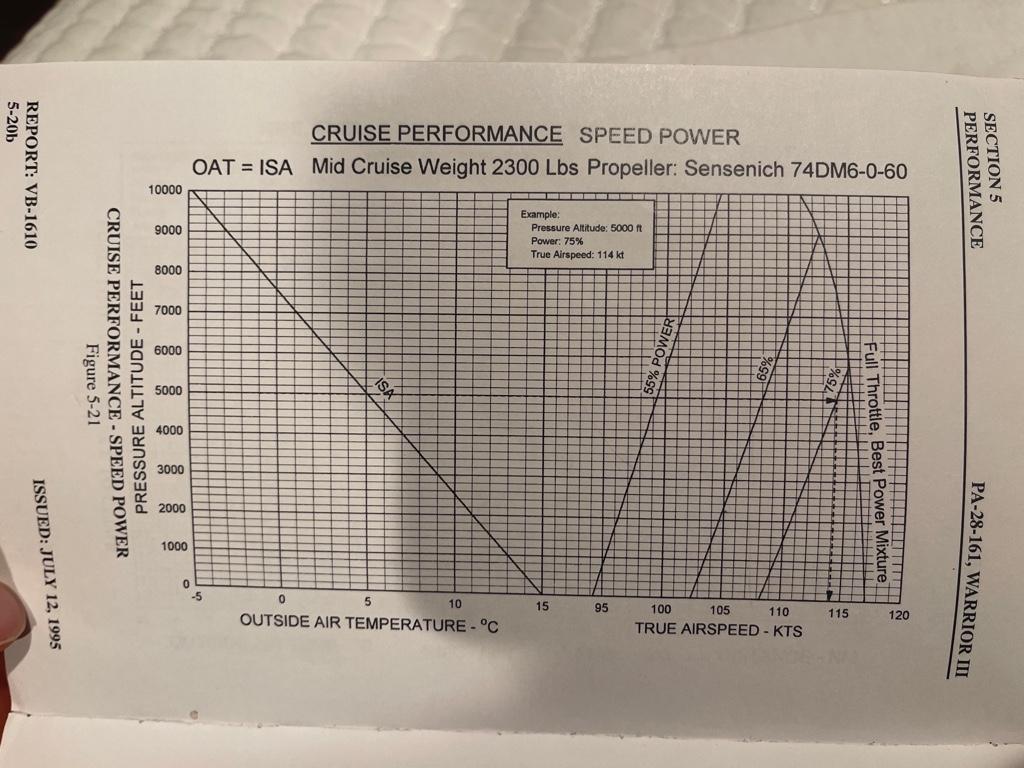
This chart has nothing to do with true airspeed. It is giving you the RPM needed to get a given rated power given OAT and pressure altitude.
HF17
Pre-Flight
- Joined
- Dec 21, 2021
- Messages
- 61
- Display Name
Display name:
HF17
This chart has nothing to do with true airspeed. It is giving you the RPM needed to get a given rated power given OAT and pressure altitude.
Oops. Wrong chart
Sent from my iPhone using Tapatalk
HF17
Pre-Flight
- Joined
- Dec 21, 2021
- Messages
- 61
- Display Name
Display name:
HF17
This chart has nothing to do with true airspeed. It is giving you the RPM needed to get a given rated power given OAT and pressure altitude.
I updated it
Sent from my iPhone using Tapatalk
The chart assumes OAT = ISA. You can either use the temperature or the altitude.
Clip4
Final Approach
To use the chart precisely, you must convert intended altitude to pressure altitude.
HF17
Pre-Flight
- Joined
- Dec 21, 2021
- Messages
- 61
- Display Name
Display name:
HF17
To use the chart precisely, you must convert intended altitude to pressure altitude.
Yeah, but the part that is confusing is that you can’t include the temperature. It only assumes the temperature is standard
Sent from my iPhone using Tapatalk
FastEddieB
Touchdown! Greaser!
- Joined
- Oct 14, 2013
- Messages
- 11,421
- Location
- Lenoir City, TN/Mineral Bluff, GA
- Display Name
Display name:
Fast Eddie B
Yeah, but the part that is confusing is that you can’t include the temperature. It only assumes the temperature is standard
I think you’re supposed to first mark up from the OAT axis to where it meets the Pressure Altitude axis. Then, from that point look horizontally across to the performance parameters on the right side of the chart. The ISA line is just there for a Standard Day reference.
HF17
Pre-Flight
- Joined
- Dec 21, 2021
- Messages
- 61
- Display Name
Display name:
HF17
I think you’re supposed to first mark up from the OAT axis to where it meets the Pressure Altitude axis. Then, from that point look horizontally across to the performance parameters on the right side of the chart. The ISA line is just there for a Standard Day reference.
That’s what I initially thought, but no matter what temperature you use, it will correspond to the same pressure altitude
Sent from my iPhone using Tapatalk
FastEddieB
Touchdown! Greaser!
- Joined
- Oct 14, 2013
- Messages
- 11,421
- Location
- Lenoir City, TN/Mineral Bluff, GA
- Display Name
Display name:
Fast Eddie B
That’s what I initially thought, but no matter what temperature you use, it will correspond to the same pressure altitude
I see what you mean.
Is the chart maybe missing lines parallel to the ISA line that would bring OAT into play?
Or something like this?
FastEddieB
Touchdown! Greaser!
- Joined
- Oct 14, 2013
- Messages
- 11,421
- Location
- Lenoir City, TN/Mineral Bluff, GA
- Display Name
Display name:
Fast Eddie B
Look at the chart label. It says "OAT = ISA". Look at the example. There is no adjustment for temperature.
I guess a way around that is to compute the Density Altitude for the non-standard temperature and use that in lieu of Pressure Altitude on the vertical axis.
HF17
Pre-Flight
- Joined
- Dec 21, 2021
- Messages
- 61
- Display Name
Display name:
HF17
I guess a way around that is to compute the Density Altitude for the non-standard temperature and use that in lieu of Pressure Altitude on the vertical axis.
Yeah, that’s what I was thinking
Sent from my iPhone using Tapatalk