Reading a web page after entering data into XL

Cap'n Jack

Final Approach
Joined
Jun 25, 2006
Messages
8,783
Location
Nebraska
Display Name

Display name:
Cap'n Jack
Option Explicit
Const WEBPAGE1 As String = "http://adds.aviationweather.gov/metars/"
Const STATIONID As String = "KLNK"
Const LISTSELECTION = 10
Public oIE As SHDocVw.InternetExplorer
______________________________________________________
Sub FillForm()
Dim objParentForm As Object
Dim objInputElement As Object
Set oIE = New SHDocVw.InternetExplorer
Dim strPage As String

'go to the web site- wait until page loads
oIE.Navigate WEBPAGE1
Do Until oIE.ReadyState = READYSTATE_COMPLETE
DoEvents
Loop

'fill out web form
Set objParentForm = oIE.Document.Forms("textForm")
objParentForm.Item("station_ids").Value = STATIONID
objParentForm.Item("hoursStr").selectedindex = LISTSELECTION
objParentForm.Item("submitmet").Click

'wait for new data
Do Until oIE.ReadyState = READYSTATE_COMPLETE
DoEvents
Loop

'get the new data
strPage = oIE.Document.body.innertext
Debug.Print strPage

'Cleanup
oIE.Quit
Set oIE = Nothing
End Sub

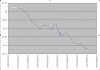
Based on another thread, I'm trying to suck down 36 hours of METAR data, parse the time and barometric pressure, and graph it so I have a really cheap graphing barometer

I'm stuck on the bold text- the data I'm seeing is the web page with the form, not the web page that comes up after the program clicks the button.

I verified with other code (that hooks into a visible IE page) that I am setting the parameters and the page is changing to one with data.

I'm missing a step here....what is it?

Thanks much!
 
Since this form is a POST submit, simplify all that and just put the form entry variable names and values on the result page's query string. You'll observe that when you submit the form you end up on /metar/index.php.

So skip all this "automated fill out the form" stuff and just change your WEBPAGE1 variable to:

Code:
http://adds.aviationweather.gov/metars/index.php?station_ids=klnk&hoursStr=past%2036%20hours

and Navigate() to it. Here's that same url in a clickable format, so you can see that it works: KLNK METAR DATA

Change station_ids to a different value if you want a different airport.
 
Troy-

That is a lot better! for some reason, the URL edit box in IE didn't show all that stuff when I manually navigated to the page -else I'd have done it just the way you suggest from the beginning. Simple is better because it usually runs faster and is less error prone.

FWIW, this is the first time I tried using a program to enter stuff into a form, so I still learned something. It would still be interesting to know what I'm missing in the original code just in case I ever need to do this for real- like if I needed to log-in to a page first before I could get the data.

Thanks much for your help!

Yeah, it won't show it in the Address box, but it's one of those "known programming tricks" if the form uses POST as it's method, you can use the form variable names and values as a query string parameter.

You're welcome!
 
It would still be interesting to know what I'm missing in the original code just in case I ever need to do this for real- like if I needed to log-in to a page first before I could get the data.

ReadyState is returning 'true' before you get all your data back. You'll see that, if you put a breakpoint in your code at the Debug.Print line, wait 10 seconds, then F8 to run it---you'll get the data you're expecting.

Change the last part to check the browser object's Busy state, instead, and you'll get the results you expect:

Code:
    'wait for new data
    Do While oIE.Busy = True
        DoEvents
    Loop
    
    'get the new data
    strPage = oIE.Document.body.innertext
    Debug.Print strPage

Isn't programming fun? And tedious?!

This works because "busy" is true when the browser is busy with a navigation or downloading process (documentation), as it is when retrieving the values of the form submission. When the busy state changes to 'false', then the data is ready.

An even better, more technically accurate method is to code a function to handle the DocumentComplete event. You can find examples of how to do that online.
 
Thanks again!

I'll save your suggestions in my program library in case I need it later. I keep a library of code since it seems I keep doing the same things.

I used your original suggestion- works great, I'm working on parsing the METAR day/time (easy) so I can tell XL how to graph it (not so easy now, it will be later. Need to work out month change within past 36 hours).

Just one note-
Currently, the DocumentComplete does not fire when the Visible property of the WebBrowser Control is set to false. For more information, see Knowledge Base Article Q259935

I'll play with that, but I do keep the browser invisible, mainly as a metter of aesthetics.
 
Jack,

I don't understand. Why don't you just use the data provided via FTP? It'd be way easier to work with. You can get cycle files which basically contain all the metars for a specific hour.

This looks interesting. I think I'll write one in PHP...
 
Last edited:
Jack,

I don't understand. Why don't you just use the data provided via FTP? It'd be way easier to work with. You can get cycle files which basically contain all the metars for a specific hour.

This looks interesting. I think I'll write one in PHP...

Which FTP site?

If you mean this one:
ftp://tgftp.nws.noaa.gov/data/observations/metar/cycles/

I still need to pull out the data for the desired station. This way I get all the data for the station I'm interested in (KLNK in this case). The data I'm using has the station data in a single location. It appears to be all the cycle files for a station in one place.

There are likely other FTP sites - but I don't know what they are.
 
And here's a working product- I left the date/time as UTC rather than local. The barameter is still down (indicating a low) although it looks like it is clearing- with the wind from the east, I suspect the rain isn't over yet...

Thanks to everyone for their help- I'm still interested in the FTP sites that Jesse mentioned.

It is a little weird getting data very indirectly from an instrument, but very efficient off a server. My original program uses a digital barometer from a BOD meter and it would take 36 hours to graph 36 hours of data. I can now get the same information in seconds.
 

Attachments

  • XLBarograph.jpg
    XLBarograph.jpg
    47.9 KB · Views: 7
Last edited:
Actually -- looking at what you're doing -- the HTTP site you chose makes the most sense.

I am building one that grabs the metars and stores them into a database and then generates graphs based on that data. This way I can go back as far as I want. Grabbing it via FTP makes the most sense for that.

I'll post the URL and the code when I'm done.

I'll be very interested to see yours.

My choice of data was based on what was given me in the PDA thread (since I don't know all the useful data sources) and the convenience of having the related data in one place.

I want to add some more to my code- clear any previous graph (done manually now) and also let the user enter a station ID. Oddly- the code to create the combined date/time for the graph's abscissa is as large as the code to get the data and parse out the data combined.

I'll post it when I have it done -- which will likely be sometime tonight. You'll be able to enter an identifier and then my server will grab the data for that identifier from that point on and provide graphs.
 
I'll be very interested to see yours.

My choice of data was based on what was given me in the PDA thread (since I don't know all the useful data sources) and the convenience of having the related data in one place.

I want to add some more to my code- clear any previous graph (done manually now) and also let the user enter a station ID. Oddly- the code to create the combined date/time for the graph's abscissa is as large as the code to get the data and parse out the data combined.
...and here is mine:
http://www.jesseweather.com/

You should be able to pull about any airport in the U.S that is in the KXXX format.

I connect to the NOAA hourly and grab all the data and put it into my own database. This will give me the ability to show graphs that span much further than 36 hours.

It is possible that a graph might end up funny for an airport -- writing code to parse METAR's is a pain in the ass and I might have missed something. I've only tested a few airports.

I have 24 hours worth of data right now. So if you try to display a weeks worth of data you won't get it. In a week you will :)

I probably spent more time on this than you did excel... 6 hours. I kept "scope-creeping" the entire time wanting to build something cooler.
 
Cool, Jesse. I like the blue line on the temp/dew point and wind/gust charts.

Next question: of what use is the data from a week or month ago to an aviator? I can see the use of the past 24 hours as a trend...
 
Next question: of what use is the data from a week or month ago to an aviator? I can see the use of the past 24 hours as a trend...
No freaking idea. I've often wanted historic data when looking into a crash or something like that. I plan on adding a date range selection which will let you narrow down on an exact time-frame.
 
No freaking idea. I've often wanted historic data when looking into a crash or something like that. I plan on adding a date range selection which will let you narrow down on an exact time-frame.

That's a good example; I have too.
 
I dropped it as another line on the y-axis for now. It works. But it's not super intuitive.
You can now view the graphs based on a time frame. Of course you'll only get about a day right now since it hasn't been running for long. Only about 10 hours into this now :)
 
Very cool!
I dropped it as another line on the y-axis for now. It works. But it's not super intuitive.
I figured out the graph- it's not that hard to read. A little compass needle like the USAir site would work well. If it were used as the datapoint for the wind speed, that would be cool- both bits of information at a glance. For calm, use an circle. If variable, use a couple of arrows whose direction is centered on the average.

Actually, I probably spent too much time on the XL version (3-4 hours)- it was something I hadn't done before; I hadn't realized that XL could be used to fill a web form. I have 2 versions- one that fills in the web form and the other based on Troy's suggestion. A lot of the time was just understanding how the code worked. Although it is visual basic, I do try to simply run more than the tutorials (although I didn't find tutorials for this- lots of bits and pieces)
 
Last edited:
I figured out the graph- it's not that hard to read. A little compass needle like the USAir site would work well. If it were used as the datapoint for the wind speed, that would be cool- bot bits of information at a glance. For calm, use an circle. If variable, use a couple of arrows whose direction is centered on the average.

BTW- what did I do wrong? I just got:
Fatal error: Can't use method return value in write context in /var/www/virtual/jesseweather.com/html/application/controllers/weather.php on line 174

Seems to be intermittant- reloading the page from scratch made it go away.
I'm coding on it while you're using it :) That was why. It should be fixed now. It is amazing how terrible the data from METARS are. I'm seeing all kinds of errors I'm trying to catch.
 
It is fixed- I edited my post while you were reading it- sorry!
 
It is fixed- I edited my post while you were reading it- sorry!
I just added a raw data option which will show you the metars used in generating the graphs. Amazing the things you can get done if you just don't go to bed.
 
Last edited:
Very nice. It works on a blackberry too, although I see the raw data.

How do you plan to collect the iphone subscription fees?:)
 
I dropped it as another line on the y-axis for now. It works. But it's not super intuitive.

That's a perfect solution! I didn't even see your note here before I saw the solution you implemented, and I figured it out right away.

What will you do with the wind direction line when the wind is calm?
 
That's a perfect solution! I didn't even see your note here before I saw the solution you implemented, and I figured it out right away.
I didn't like it at first. But now it's growing on me. You can see dramatic changes in wind direction which is also useful info.

TangoWhiskey said:
What will you do with the wind direction line when the wind is calm?
It goes to a 000 heading. It also goes to 000 if it is VARIABLE. I'm not sure what the best action would be. I have to set it to something on the scale.
 
I didn't like it at first. But now it's growing on me. You can see dramatic changes in wind direction which is also useful info.

It goes to a 000 heading. It also goes to 000 if it is VARIABLE. I'm not sure what the best action would be. I have to set it to something on the scale.

That works, and is the behavior I'd expect. :yesnod:

When do you sleep, man?
 
That works, and is the behavior I'd expect. :yesnod:

When do you sleep, man?
I skip a night sometimes. Usually when I need to get something done and there just aren't enough hours in a day. Something has to go.

This was just interesting and I didn't want to go to sleep :)
 
I skip a night sometimes. Usually when I need to get something done and there just aren't enough hours in a day. Something has to go.

This was just interesting and I didn't want to go to sleep :)

Next question: which languages/technologies did you use? I know you're often dabbling in something new or different, and other times using the ones you're more adept in.
 
<SNIP>
This was just interesting and I didn't want to go to sleep :)

That's the reason I started this...it was interesting, I'd get something useful out of it, and I may be able to use the code (or what I learned in writng the code) for something else.
 
Next question: which languages/technologies did you use? I know you're often dabbling in something new or different, and other times using the ones you're more adept in.
Linux 2.6
Apache 2
PHP 5.2
MySQL 5.1
Kohana 2.2 Framework
JpGraph PHP library for the graphs
 
Back
Top