You are using an out of date browser. It may not display this or other websites correctly.
You should upgrade or use an alternative browser.
You should upgrade or use an alternative browser.
Icing info
- Thread starter Let'sgoflying!
- Start date
TangoWhiskey
Touchdown! Greaser!
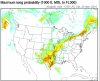
I have a friend who is driving back to Fort Worth from New Mexico; they are stopped in Amarillo now; said they have 3" of ice on the ground. I think the analysis is correct. Don't know why they haven't issued Sigmets for the conditions.
Dave ,
Use this http://aviationweather.gov/products/gairmet/
I am planning a trip into Illinois for this afternoon and almost got "fooled" as well..something isnt working right with ADDS.
Use this http://aviationweather.gov/products/gairmet/
I am planning a trip into Illinois for this afternoon and almost got "fooled" as well..something isnt working right with ADDS.
TangoWhiskey
Touchdown! Greaser!
Dave ,
Use this http://aviationweather.gov/products/gairmet/
Cool, that matches the 2nd image Dave posted, much better:
Attachments
TangoWhiskey
Touchdown! Greaser!
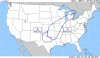
Ah, there are no Icing SIGMETS (red) right now; and the AIRMETS are only shown on G-Airmets now...
Let'sgoflying!
Touchdown! Greaser!
I think they need to have the airmets on page 1; it used to be a useful quick-screening tool. I wonder how many will scroll over it quick and conclude 'all is well, let's go'?
Dave Siciliano
Final Approach
Scott D. just did an article on why icing may not show up on the ADDs SIGMET or AIRMET product in Twin & Turbine. Worth a read. Yes, ADDs moved the AIRMETS to a separate page. While I like the new layout, the old format where if there is a lot of stuff you get a heads up was good.
Best,
Dave
Best,
Dave
bbchien
Touchdown! Greaser!
Let'sgoflying!
Touchdown! Greaser!
That will fix my issue, the map.
Looking at a blank map (when previously it would be blank only if there were no airmets) was the problem.
Thanks
Looking at a blank map (when previously it would be blank only if there were no airmets) was the problem.
Thanks
- Joined
- Aug 13, 2007
- Messages
- 3,183
- Display Name
Display name:
Bob Gardner
Here's a quick peek at what the static G-AIRMET charts will look like:
http://bcaws.aviationweather.gov/products/gairmet/display_gairmet.php
Don't link to these charts just yet since the URL will change after the new web page goes operational sometime next week.
Good information, Scott...timely, too, because I am just re-writing the weather sources chapter in my private book.
Any changes in view relating to graphic SIGMET?
Bob Gardner
peter-h
Line Up and Wait
I am writing from the UK (Europe) where we don't have most of the detailed US aviation weather services.
As a very general question: do these "area icing" charts mean very much in practice?
Obviously if you are high enough to be in VMC, then you won't pick up ice. And if you are in IMC, between 0C and about -15C (nonconvective cloud assumed) then icing is IMHO a certainty eventually, so one should not fly in such conditions on a long enroute section unless appropriately de-ice equipped and, if significant convective (in this case embedded TCU/CB ) weather is forecast, radar as well.
I have seen "icing hazard" charts for Europe, most notably here (under Flight Hazards), but they just seem to correlate with where one would obviously expect convective conditions by taking one look at any chart that shows fronts e.g. here.
In between fronts that are say 200nm apart, I don't see how one can reliably forecast where one parcel of air is going to have more supercooled water droplets than another parcel lying say 50nm away. And on the actual location of a front (which is usually pretty obvious from one look at a satellite image) you could draw an area showing an icing hazard and be right 90% of the time")
Does the above make any sense?
As a very general question: do these "area icing" charts mean very much in practice?
Obviously if you are high enough to be in VMC, then you won't pick up ice. And if you are in IMC, between 0C and about -15C (nonconvective cloud assumed) then icing is IMHO a certainty eventually, so one should not fly in such conditions on a long enroute section unless appropriately de-ice equipped and, if significant convective (in this case embedded TCU/CB ) weather is forecast, radar as well.
I have seen "icing hazard" charts for Europe, most notably here (under Flight Hazards), but they just seem to correlate with where one would obviously expect convective conditions by taking one look at any chart that shows fronts e.g. here.
In between fronts that are say 200nm apart, I don't see how one can reliably forecast where one parcel of air is going to have more supercooled water droplets than another parcel lying say 50nm away. And on the actual location of a front (which is usually pretty obvious from one look at a satellite image) you could draw an area showing an icing hazard and be right 90% of the time
Does the above make any sense?