- Joined
- Dec 5, 2010
- Messages
- 5,155
- Display Name
Display name:
GeorgeC
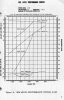
I'd been having a hard time interpreting charts like the one I have attached.
The glossary defines "propeller load curve" as "a plot of horsepower, fuel flow, or manifold pressure versus RPM through the full power range of one engine using a fixed pitch propeller or a constant speed propeller running on the low pitch stops."
That was clear as mud to me, so I googled "propeller load curve", and came up with a yachting site that did a decent job of explaining it in terms of power available vs. power absorbed:
http://www.yachtingmagazine.com/deciphering-your-engines-performance-curve