MOS - Garmin Pilot versus Foreflight Discrepancy?

Aviator305

Pre-takeoff checklist
Joined
Apr 8, 2015
Messages
215
Display Name

Display name:
Juan
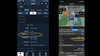
As I was trying out GP, I observed the following discrepancies between the MOS information displayed by each app. Foreflight paints a picture of severe weather (thunderstorms and cumulonimbus), while Garmin Pilot reports a low chance of precip. I also notice that the wind and cloud information is different between the two, but I am more concerned about the severe weather information.

I would think that both apps should display the same data given that they are both MOS. How could this happen?

AD75E9C8-CD50-494D-A2B2-FA7588143E9F.jpeg 38645775-5578-4642-B382-B5FCAE73CE75.jpeg
 

Attachments

  • E7A7A8C0-79B2-436B-A6A9-745FD9E0BD4F.jpeg
    E7A7A8C0-79B2-436B-A6A9-745FD9E0BD4F.jpeg
    135.3 KB · Views: 10
Please ensure that you have the latest MOS in Garmin Pilot. Look at the end of Data Services and the Refresh button.
 
Lately (over the last few months) Garmin pilot has been having some issues with what they have termed "stale weather data". I have reported these issues to them and they have sent me beta test software which logs activity to a special file that I email to them periodically. As such, I do not trust the weather data in GP but they have been very responsive and I am sure they will fix the issue very quickly.
 
stale weather data

In looking this up, it seems that this term involves ADSB data. Have you observed issues with MOS?

I have confirmed I am looking at the most recent run on Garmin Pilot, or at least the app seems to think it’s the last run as per the time stamp at the bottom of the screen.

Digging a bit deeper led me to the MOS section of the National Weather Service website. It seems that MOS is a text output and that there are at least two models, NAM and GFS. While I would be interested to know which model each app uses, I find it hard to believe that either model would be so egregiously inaccurate relative to reality. At the time corresponding to the screenshots in my original post, real life weather did turn out to be abysmal as predicted by MOS on Foreflight. Performing the same exercise a day later, the Garmin Pilot MOS again grossly underestimated the severity of the weather. I am forced to wonder if there is an issue with the decoding the text based MOS information.
 
Last edited:
Look at the forecast times in your two examples. Top picture on the right with 1% chance is for 14:00 to 15:00, the one with 5% is for 15:00 to 16:00. You can see the 15:00 to 16:00 one is the same if you look down just a bit. It's the same issue across all of them - comparing apples and pears.
 
@Hang 4
The discrepancy I am trying to show is Garmin Pilot versus Foreflight. I included two pairs of Garmin Pilot so that one could see the time range represented in each Foreflight screenshot, as the time ranges in each app did not line up perfectly. For the overlapping ranges of time, the Garmin Pilot readout shows a very low probability of rain, while Foreflight is showing RAIN, THUNDERSTORMS, and CUMULONIMBUS. This is all from the MOS section of both apps. I hope that clarifies my question.
Two things - one, if the time ranges don't line up exactly, it's likely FF and GP are using different models (NAM vs GFS). IIRC, NAM has shorter and more frequent forecast intervals. Second, a low % precip probability and T-storms in the area are not mutually exclusive. The % probability is that there will be rain in a specific spot, not that there will or won't be rain in the area. Yesterday and today had fairly low % probability of precip, but there were t-storms around. Earlier in the week, the % probs were higher, and there were many more storms. Lastly, in FL, the forecast can be pretty precise on timing of convective activity in certain weather patterns. Last couple days, it was very low % probability of precip before 2 pm, a bit higher late afternoon and dropping back to near zero after 8.
 
I understand the need to have inaccurate weather forecasts at least line up with each other.
 
In looking this up, it seems that this term involves ADSB data. Have you observed issues with MOS?

I have confirmed I am looking at the most recent run on Garmin Pilot, or at least the app seems to think it’s the last run as per the time stamp at the bottom of the screen.

Digging a bit deeper lead me to the MOS section of the National Weather Service website. It seems that MOS is a text output and that there are at least two models, NAM and GFS. While I would be interested to know which model each app uses, I find it hard to believe that either model would be so egregiously inaccurate relative to reality. At the time corresponding to the screenshots in my original post, real life weather did turn out to be abysmal as predicted by MOS on Foreflight. Performing the same exercise a day later, the Garmin Pilot MOS again grossly underestimated the severity of the weather. I am forced to wonder if there is an issue with the decoding the text based MOS information.
I can't believe with your attention to detail you so egregiously "misunderestimated" how to spell the past tense of lead. It's led btw. Just kidding. Very interesting post. :cheerswine:
 
For those that are interested, Garmin just updated pilot to version 8.2.2 which seems to have corrected a number of issues. I have not had a chance to fully evaluate this version but a cursory look seems more stable and a number of bugs have been corrected.
 
For anyone interested in this topic, this is what I concluded after finding and trying to match the source data to each app. Foreflight seems to align with the output from GFS short MAV bulletin. Garmin Pilot seems to align with the LAMP output in the short run and then transitions over to the MAV bulletin at about the 3rd day of the run (one can observe shorter/more frequent time ranges at first for LAMP before the transition). After looking at the cards (MAV Card - MDL - Virtual Lab (noaa.gov), LAMP Card 2.3.0 - MDL - Virtual Lab (noaa.gov)), I suspect that the descriptors "Rain, Thunderstorms, Cumulonimbus" displayed on Foreflight's MOS tab are either derived from some internal logic by Foreflight or are simply carried over from the TAFs. I did not see an element in either card that directly correlated with these descriptors.

I have never really used or trusted MOS, but the discrepancy between the two apps showing presumably the same product made me question the source of all this information. I did not know that there were so many MOS sources. I had hoped that the MOS on GP could be a substitute for the "Daily" tab on FF which has served me the best for short-medium range weather planning in central/south Florida during the past couple of years. However, that weather information comes from The Weather Company (not the Weather Channel) which is an IBM company. So, this is proprietary and apparently without direct analogue on any of the other apps. After looking at MOS overall more closely during the last couple of days, I am pretty certain it's the least helpful tool for weather planning.
 
Last edited:
Thanks for doing all that digging. I never used any of the MOS products and it seems like the weather service is moving away from them as well. For medium range weather, I use Windy.com. It lets you look at pretty much all the models and gives you a good sense of how extensive the convective activity will be. In FL in the summer, there's a 100% certainty there will be a thunderstorm somewhere, just a question of when, where and how extensive they are going to be. I've found the European model (ECWMF) to be the most accurate for several days out. NAM is pretty good for very short term (24 hours or so). I only use GP for current conditions and the TAF. The last thing I'd suggest, particularly for FL in the summer is the discussion tab. They do a pretty good job of describing the upcoming weather and what might make it different from the forecast.
 
@Hang 4
We are pretty much on the same page regarding the models. For the less than 24-hour period, I like the High-Resolution Rapid Refresh (HRRR) model.

I checked out Windy.com and the app this weekend for the first time. It is very nice, but see what you think about the following links. Just make sure that you have the latest run selected on the drop-down menu on the left.

HRRR https://www.pivotalweather.com/model.php?m=hrrr&p=refcmp&rh=2022072501&fh=loop&r=us_se&dpdt=&mc=

NAM 3km CONUS https://www.pivotalweather.com/model.php?m=nam4km&p=refcmp&rh=2022072500&fh=loop&r=us_se&dpdt=&mc=

Seeing an hour-by-hour projection of the radar return helps me make educated guesses about when I should plan to depart or if I should plan to depart at all. A common use case for me is in determining whether a dying system on the current whether is likely to find new life in the coming hours (such as when the AFD mentions colliding sea breezes).
 
Back
Top