Skew-T question

sarangan

Pattern Altitude
Joined
Jun 7, 2008
Messages
1,896
Display Name

Display name:
Andrew, CFI-I
I am hoping some of you might be experts on this very useful weather product.

I asked this question to NOAA, but never got a response.

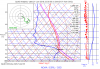
NOAA's interactive sounding charts also include a calculated parameter called CAPE (Convective Available Potential Energy). This is a very useful number that indicates the intensity of lifting action and hence the severity of thunderstorms. There is also another number called iCAPE (i stands for interactive). This is the CAPE for a parcel of air that is at a user-defined temperature. My confusion is that I can get CAPE=iCAPE only when I select a parcel temperature that is about 10C higher than the sounding data shown in the plot. For example, in the attached image, the temperature for 1050mb is 17C and CAPE is 90 J/g. I can get iCAPE of 89 J/g if I pick a 1050mb parcel temperature of 26C, which is 9C higher than the sounding data. Obviously I am missing something here.
 

Attachments

  • RUCS.png
    RUCS.png
    230.6 KB · Views: 29
In that parcel shown that is definitely a low CAPE situation first off.

I'm guessing your problem is that yourey modifying a temp at 1050mb instead of a more realistic pressure surface. Looking at the chart that's supposed to be the ORD area, at that elevation you'll never have an actual 1050mb surface pressure, except maybe a massive Arctic outbreak when CAPE would be irrelevant. You're running the
parcel into a giant abyss below sea level (deeper than that big old quarry under the tri state ;)) at a dry adiabatic lapse rate, which would need to be significantly warmer than the actual surface temperature/pressure to generate the equivalent CAPE.

Thanks for the response. I don't think the 1050mb pressure level is the issue. Here is a better example, for OKC. Surface is 980mb, and temperature is 33C. CAPE value is 570. I get an iCAPE of 560 by setting a parcel temperature of 39C at the same 980mb level. The purple line is the user-defined parcel. Red line is the sounding data.
 

Attachments

  • OKC.png
    OKC.png
    66.7 KB · Views: 19
@scottd - I took one of your courses and I am still amazed at the amount of information you gave us, and a SKEW-T chart can show. Just wanted to pass along a thank you.
 
Scottd, how long realistically does it take to study up to the point where these graphs can be used competently? I'm an engineer with a BSME degree if that helps at all?
 
At least someone sees the value of my expertise!!! ;)


First of all, CAPE is just what it says...potential energy. It's not really "lifting action" as much as it shows *how much* positive buoyancy exists once the parcel reaches the level of free convection (LFC). You can have CAPE values over 5000 j/kg and no chance of deep, moist convection. I explain this in my Mastering the Skew-T program.

There are actually several flavors of CAPE (as well as LI). That includes surface-based CAPE (SBCAPE), mean layer (or mixed layer) CAPE (MLCAPE), and most unstable CAPE (MUCAPE) also called "best" CAPE. The CAPE value that is shown on the chart is best CAPE (MUCAPE). MUCAPE provides you the "highest" or "best" CAPE when lifting all possible parcels of air from the surface to 300 mb. This helps to identify the potential for elevated convection when the atmosphere near the surface is rather stable (like the one you attached). iCAPE is calculated where you start the parcel - by clicking on the diagram. :geek stuff to follow: Note, that the MUCAPE value they calculate takes into account virtual temperature. The iCAPE does not. This may cause errors > 30% for values of CAPE below 500 J/Kg, but smaller error for larger values of CAPE. If you really want to dig into this virtual temperature thing, a great explanation is here.

In the end, it'll be hard to actually "replicate" the CAPE value they show given this virtual temperature issue. I hope this helps.


Wonderful explanation. Thanks a million. Where can I take your Mastering Skew-T course? I am definitely interested.
 
What is the best app to use for Skew-T? I've been using the free one on Android that works pretty well. It is kind of strange the way it handles time though, and only lets you select certain hours in the day.

I've been glancing at the Skew-T before each flight to see how accurately it predicts turbulence.. so far, it's given a pretty good idea.
 
Wonderful. Glad to hear it. We are working on a pretty cool implementation for the Skew-T in WeatherSpork. It will really boost its overall utility.
Looking forward to that. I continue to use what you taught me in the live classes. But sometimes getting the rucsoundings sight to bend to my will isn't as easy as I wish it was.
 
It entirely depends what you are looking to learn? I can teach you how to find the freezing level in about 10 minutes or less. I can teach you how to find stratiform bases and tops (including nimbostratus) in about 30 minutes. It'll take several hours to teach you how to identify cumulus bases and tops. Then there's icing and turbulence...a few more hours for those two. My Mastering the Skew-T online program is about 3 hours long and I also have a recording of a live workshop I did on this that's a little over 5 hours.

I also do one-on-one online training...I find when pilots attend my live course, they may leave without seeing the true practical use until they spend about an hour with me for a flight they are proposing. It really helps to understand how to integrate all of the other tools together with the Skew-T.

Ultimately, it's really best used as a drill down tool. For example, last fall I was making a flight over the Appalachian Mountains and there was a PIREP for severe turbulence. So I pulled out the Skew-T for that area and could see it was thin layer turbulence isolated to a 1000 foot or so due to a baroclinic atmosphere which gave me the information I needed to make a comfortable flight.

Thanks, I'll check out your website, working on my IR now, so I'm a little saturated.
 
Back
Top