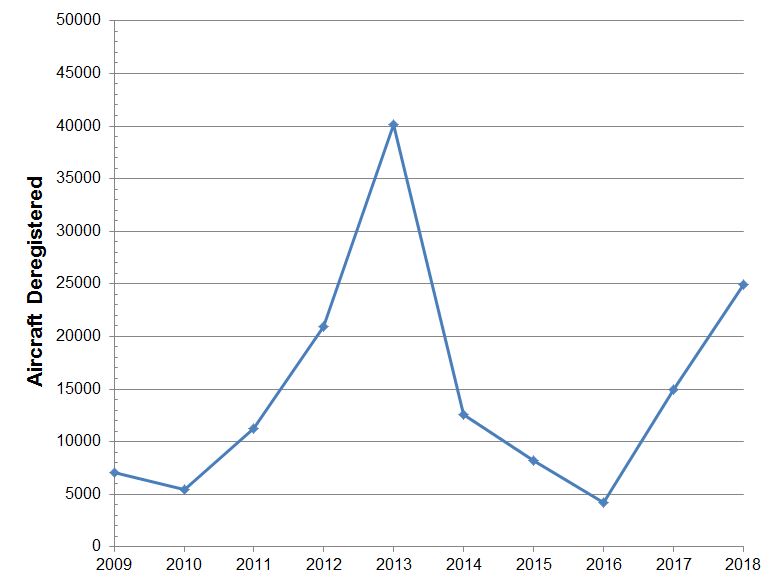
This is another view of the effects of the FAA re-registration program. Starting in 2010, aircraft owners were required to confirm their aircraft registrations every three years.
The effect of this is hard to understand with a bunch of hand-waving. I've generated a set of graphics to show the effect.
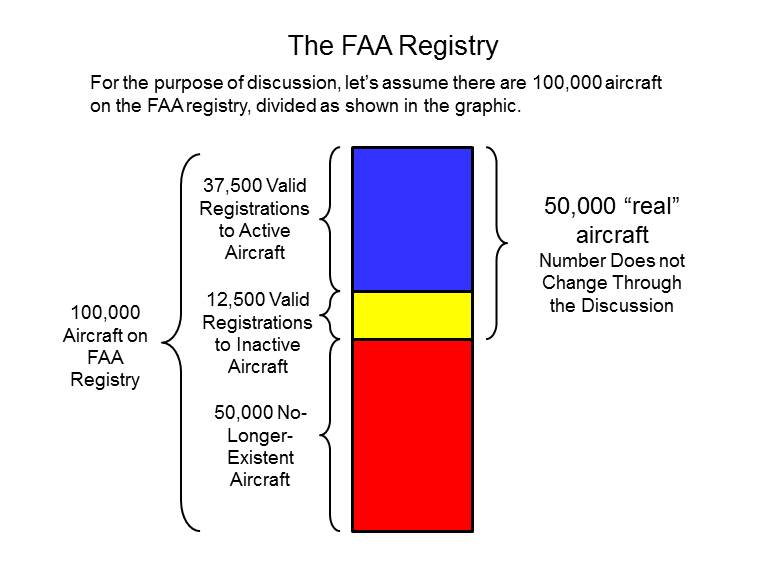
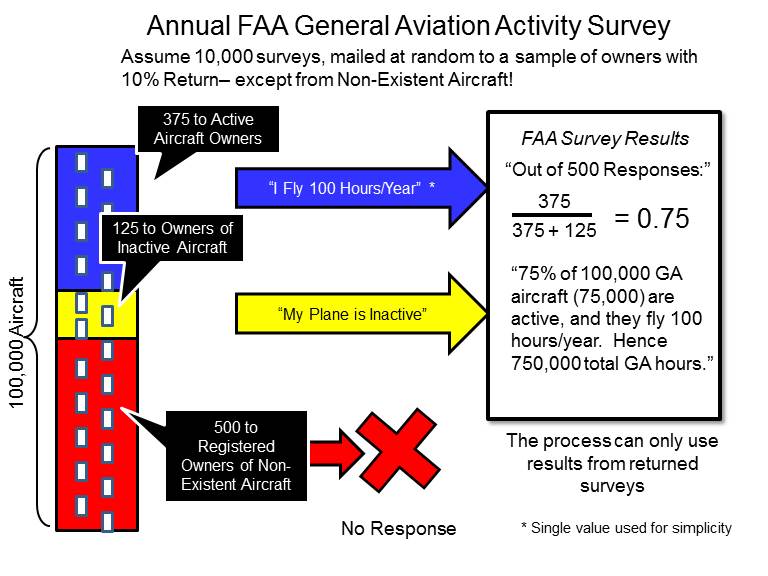
This first image shows a notional breakdown of the FAA registry. Let's assume there are 100,000 airplanes in it (actual is about 300,000). Prior to 2010, aircraft were only removed from the registry upon their owner's request. So the only entities actually cancelling registrations were corporations and insurance companies. So Great-Uncle Jim's Piper E-2 might still be listed, even though he scrapped it before WWII.
The first figure shows the notional breakdown of our 100,000 airplane set. Half the registrations are existing aircraft, the other half are aircraft still on the registry but with no valid owner associated with them (again, these numbers are for illustration, not actual estimates).
Of the 50,000 "real" airplanes, let's assume 75% of them are actively flying, and the other 25% have valid owners who aren't active.
The FAA General Aviation Survey uses the FAA registry to send surveys to a sample of the registrants. The recipients are chosen at random. Let's assume the FAA sends out surveys to 10% of the owners of record on the registry. Let's assume that 10% of the owners of valid-registration aircraft return them.
That means the Survey will receive 375 responses from owners of active aircraft, 125 from owners of inactive aircraft....and none from the old, out of date registrations.
That's not a problem with the Survey. They base their results on the data on returned surveys, and don't make any assumption about the ones that didn't get answered (remember, many of those went to valid registrations and the owner didn't bother to answer).
Let's assume every active owner says he or she flies 100 hours per year. The Survey folks take the responses, and compute that 375 out of 500 GA aircraft is active. So 75% of the GA fleet is active, and since they all fly an average of 100 hours per year, the total GA fleet flying time for that year was 750,000 hours.
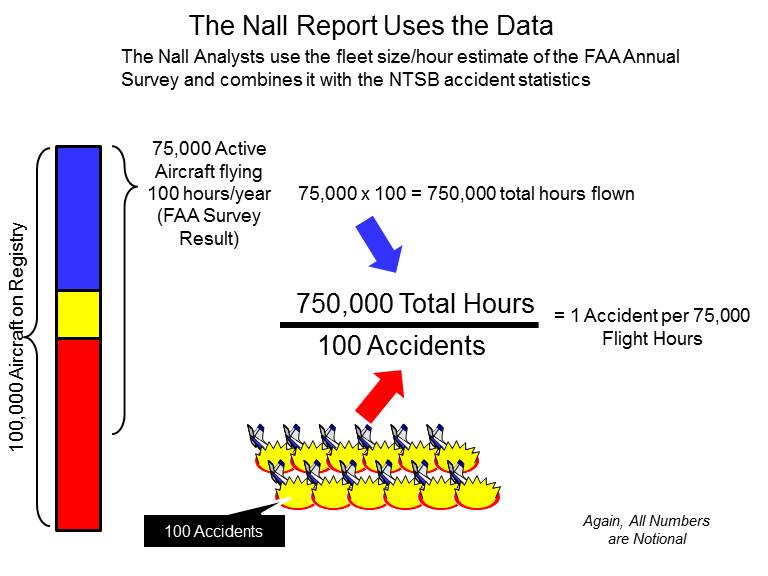
OK, let's turn things over to the Nall Report folks. They look at the NTSB records and determine that there were 100 accidents that year. Couple that with the FAA Survey's estimate of 750,000 GA flight hours, it's obvious that there is a GA accident every 7,500 hours. Again, perfectly acceptable methodology.
With me so far? Let's start looking at how the FAA re-registration process gums up the works.
After 9/11, the FAA had to admit that they'd lost track of tens of thousands of aircraft in the US. Aircraft that were still on the registry, but they didn't have a valid owner listed. Congress was not happy.
Starting in 2010, the FAA requires that owners of aircraft confirm their registration and address every three years. They get a notice from the FAA, and have to return a confirmation and $5 to retain their aircraft's license. If they DON'T do this, their registration is cancelled and the plane removed from the FAA registry.
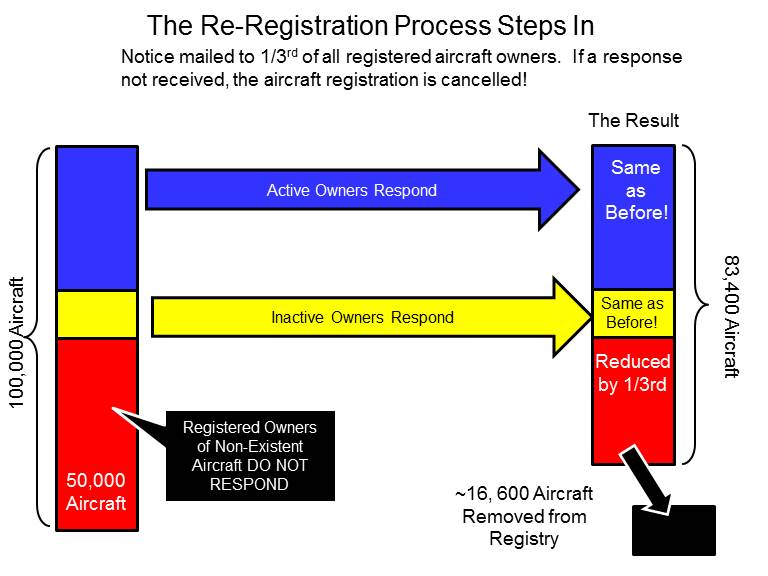
The FAA phased in the implementation of this, so that a third of the US fleet comes up for confirmation every year.
This graphic shows how this works. The Valid registrants, both active and inactive, respond to the re-registration demand and their airplanes remain on the registry. Of course, no response is received from the invalid registrations. So on this first year, the FAA cuts 16,600 aircraft from the registry.
Note that this ONLY affects aircraft with bad registrations. THERE IS THE SAME NUMBER OF VALID REGISTRATIONS, because the owners of these aircraft receive the FAA notice and respond.
(in reality, there is always some subset of of owners that DON'T respond, and end up getting their registrations cancelled. They can re-activate them with little effort for the first five years; beyond that, they risk having their N-numbers reassigned.)
The main point here is that the number of flying, active aircraft HAS NOT CHANGED. All the aircraft removed are obsolete registrations; many of the planes haven't existed for years.
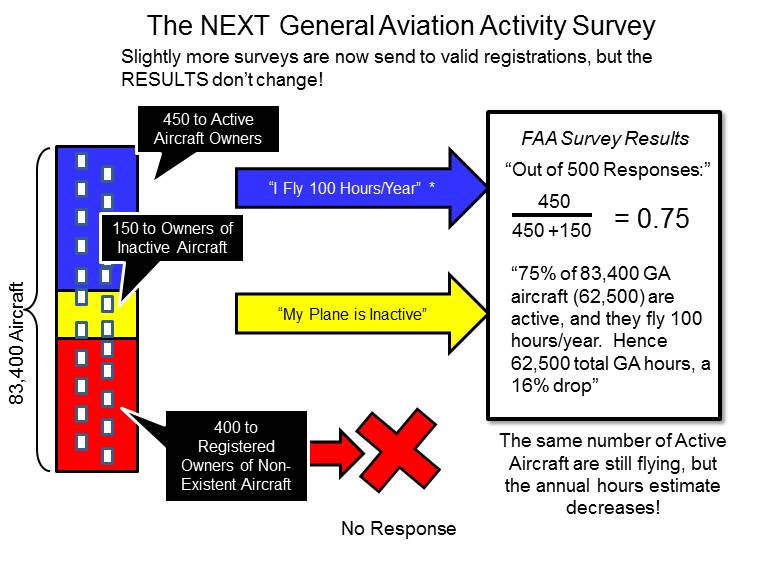
So, what happens the next time the FAA Survey rolls around? One good thing is since there's less "deadwood" in the registry, more real owners receive surveys. But the percentage of active vs. inactive aircraft hasn't really changed. It *still* comes out at 75%.
The problem is, the overall fleet size (which includes the invalid aircraft) is lower... so the computation of the total hours flown by the GA fleet is lower as well.
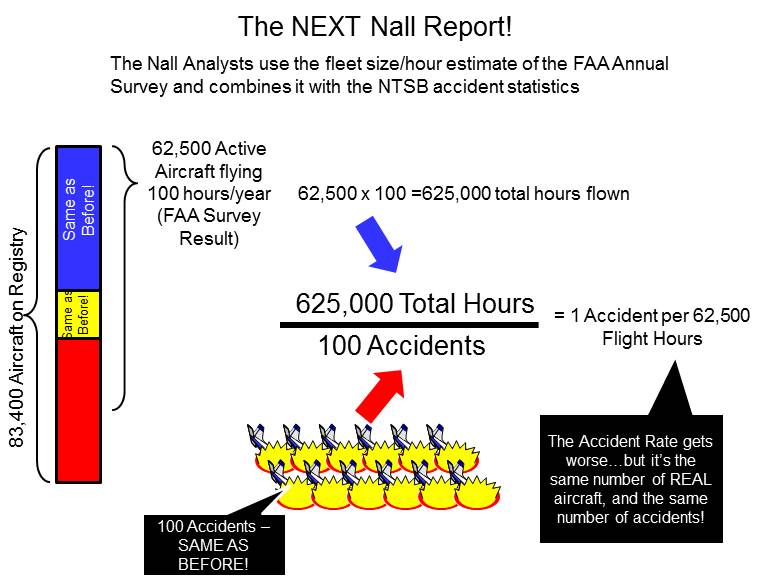
This, of course, is NOT the actual case. We've got the same number of active aircraft, flying the same number of hours per year. But because the "official" fleet size decreased, the result is a lowered estimate of annual utilization.
You can see where this is going, when we hit the next Nall report. It's the same number of active aircraft, and the SAME number of accidents...but because the estimated annual utilization has gone down, the GA accident rate goes up.
So that's how the re-registration process is affecting the estimate of the GA accident rate.
The FAA Survey folks and the Nall Report people are eminently qualified. Me, I'm just an 'ol retired engineer who likes working with numbers. It's just that their processes were developed in an era before the FAA re-registration kick.
Over the long term, it doesn't matter...but in the short term, we're going to see some spikes and valleys in the accident rates that have little do do with actual safety. Let's not get ourselves too wound up about it.
Ron Wanttaja